
Case study · IBM Cognos Analytics
Case Study: Improving how users manage data connections in Cognos Analytics
Taking a complex task and making it simple
Project brief
This is a quick look at one of the more significant projects I tackled as part of my work on IBM Cognos Analytics. Aimed primarily at enterprise clients, Cognos is a data analytics, reporting and visualization tool. We help enterprise clients working with large amounts of data from disparate sources, to help them gain business insights and manage their operations. Here’s a quick promo showing some of the this in action.
The first task performed in any data analytics tool is… well… uploading data. Users today have the option of uploading their datasets directly, or connecting to an outside database and importing their assets from there.
My focus was improving the experience, design and efficiency of the second task, as well as how users managed these connections later on. Here’s how my team and I tackled this.
Laying the groundwork
The bulk of the team is based in Ottawa, so I flew down for two days to help kick things off. My primary goal was to learn, ensure we had a shared understanding of the problem we were trying to solve and tease out questions we still had.
Persona Review
Cognos has historically been a B2B, on-prem only product. If you wanted access, you had an IBM rep show up, work with your IT team to set things up and train your staff, and then IT would run everything in a very tightly managed environment. For many of our clients this is still the case.
However as we move towards turning Cognos into more of a cloud based, self managed product, this model has changed.
Connecting to new data sources is now a task that’s done increasingly by the data analysts themselves. People who don’t have an admin team to contact, or can’t wait in a queue for 2 days before getting their data.
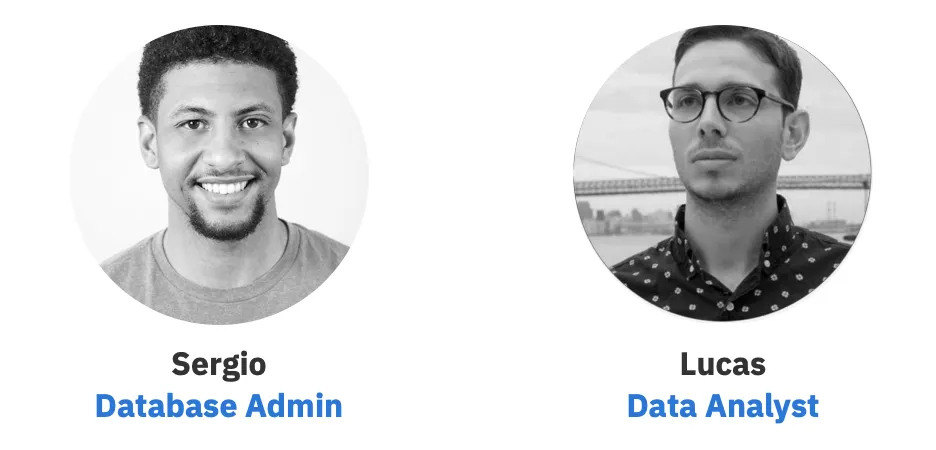
So we started by aligning on who our key personas were and reviewing existing user feedback. Our primary persona was Sergio “The Admin”, but after some discussion it became clear that we had a secondary user — Lucas “ The Data Analyst”.
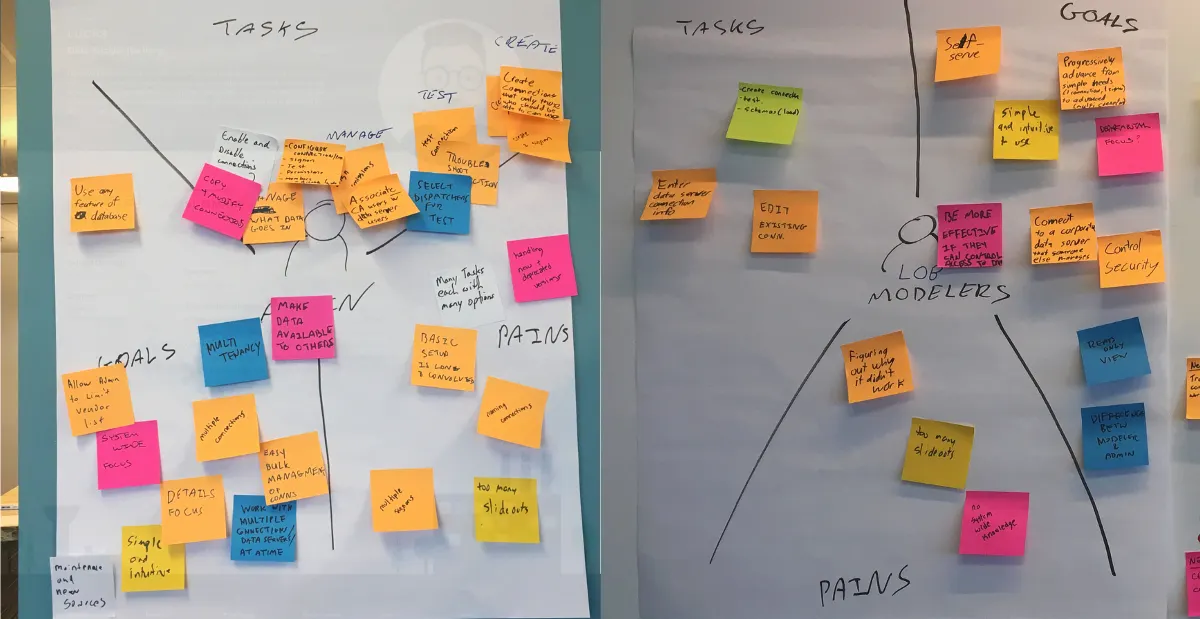
After reviewing their summaries we started working through each user’s Tasks, Goals and Pains (a slight twist on the classic Tasks, Pains and Gains exercise). This helped us compare and contrast what each user is trying to accomplish and the challenges they face.
Needs statements
Then it was time for needs statements — what are users actually trying to accomplish and why.
After diverging and everyone putting up various different needs statements, we began to converge and cluster them. As we did, a few patterns emerged. On a high level, both users needed to be able to do the following with ease:
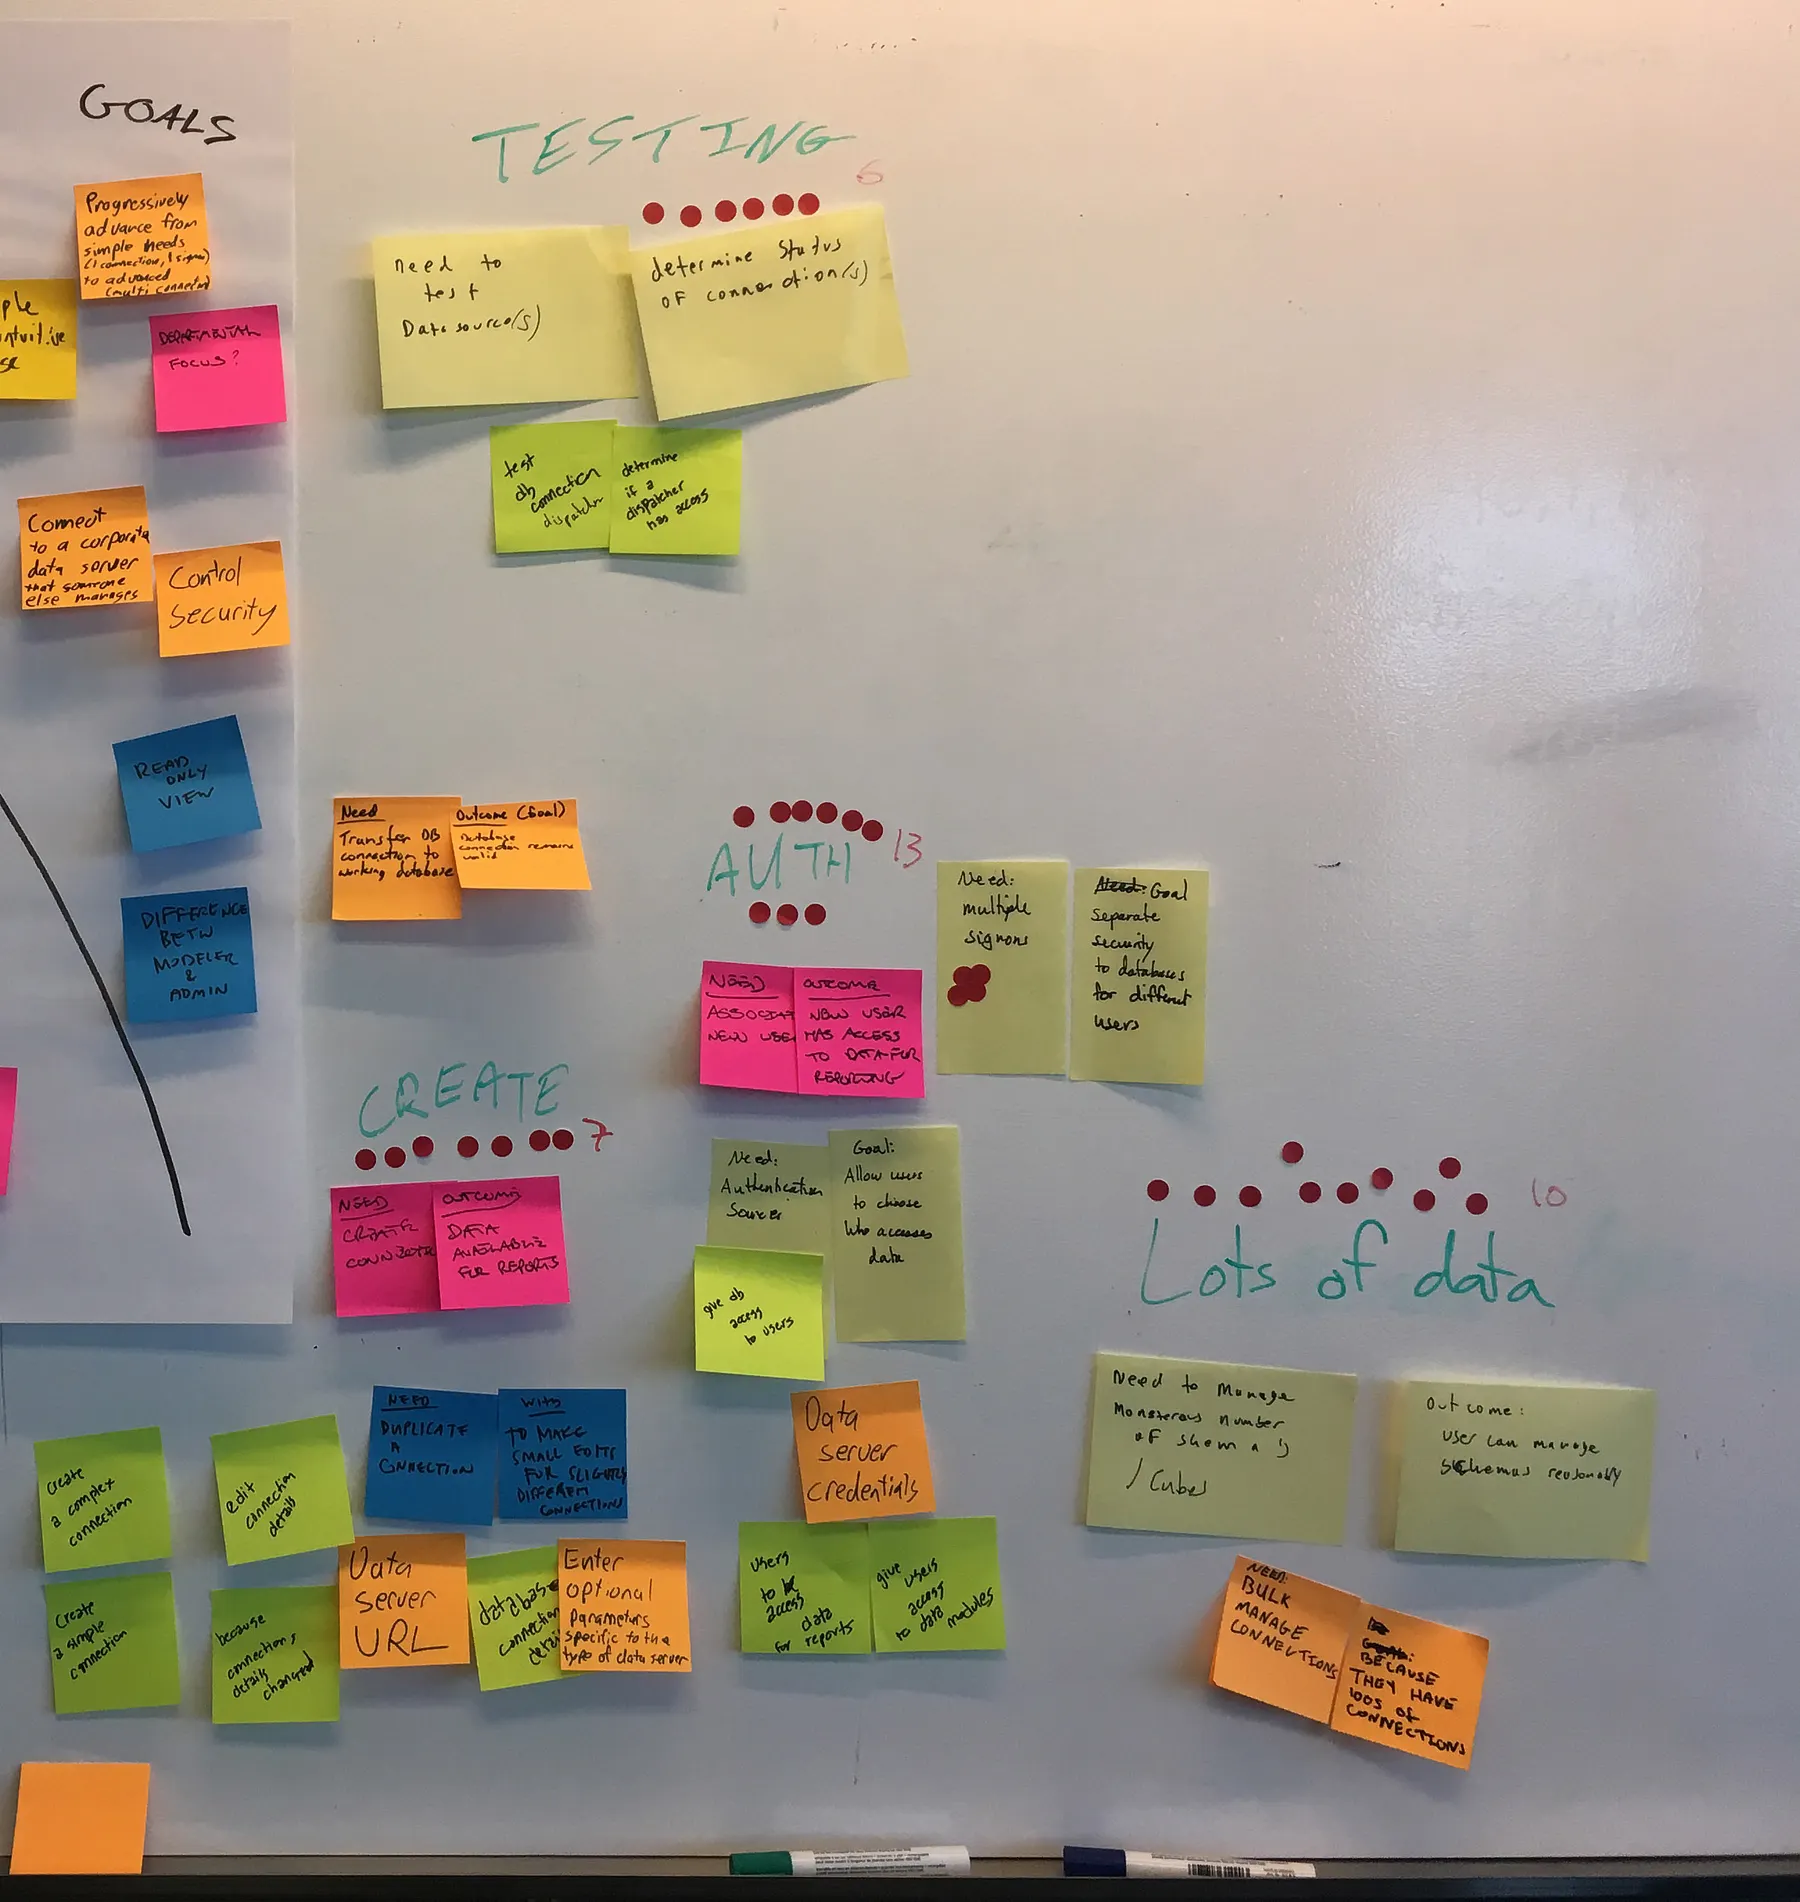
- Create new connections from within the context they’re used to working in. For admins, this was the existing admin panel — where this task is done today. For analysts, this had to be done as part of their existing data shaping workflow.
- Analysts generally need to set up simple connections quickly so they can get to their business insights.
- Admins need to do more extensive customization and set up more complex connections in order to track and control access, as well as test and edit multiple connections.
We teased out a few more but I wanted to have these ready for our next exercise. Our needs statements also helped keep us focused later on when we had to define what our MVP is, and push back against scope creep. If something was proposed that didn’t directly address our needs statements, it was pushed out of MVP.
As-Is Scenario Mapping
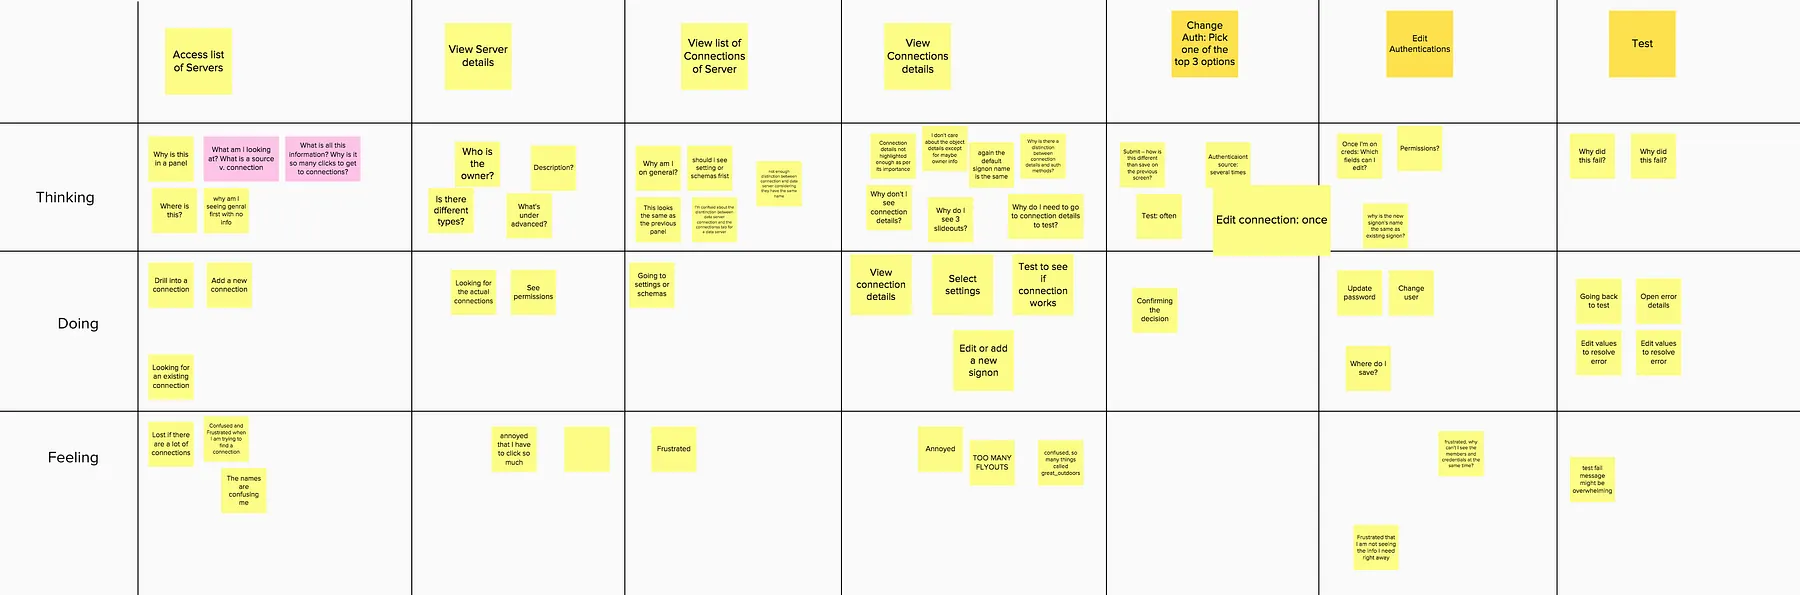
We used our needs statements to help guide us as we did an As Is Scenario Map.
If a sys admin wants to edit the details of an existing connection to fix an error, so their CFO can update their dashboard, what would they have to do?
The As-Is scenario helped us break things down into steps and gain a more thorough understanding of what the current pain points were
To help give you a bit of context, here is the current process for simply getting to the connection details screen showing the URL. (Assuming you know where to click).
Cognos is a really powerful tool, but parts of the admin experience have clearly been neglected.
Sketching
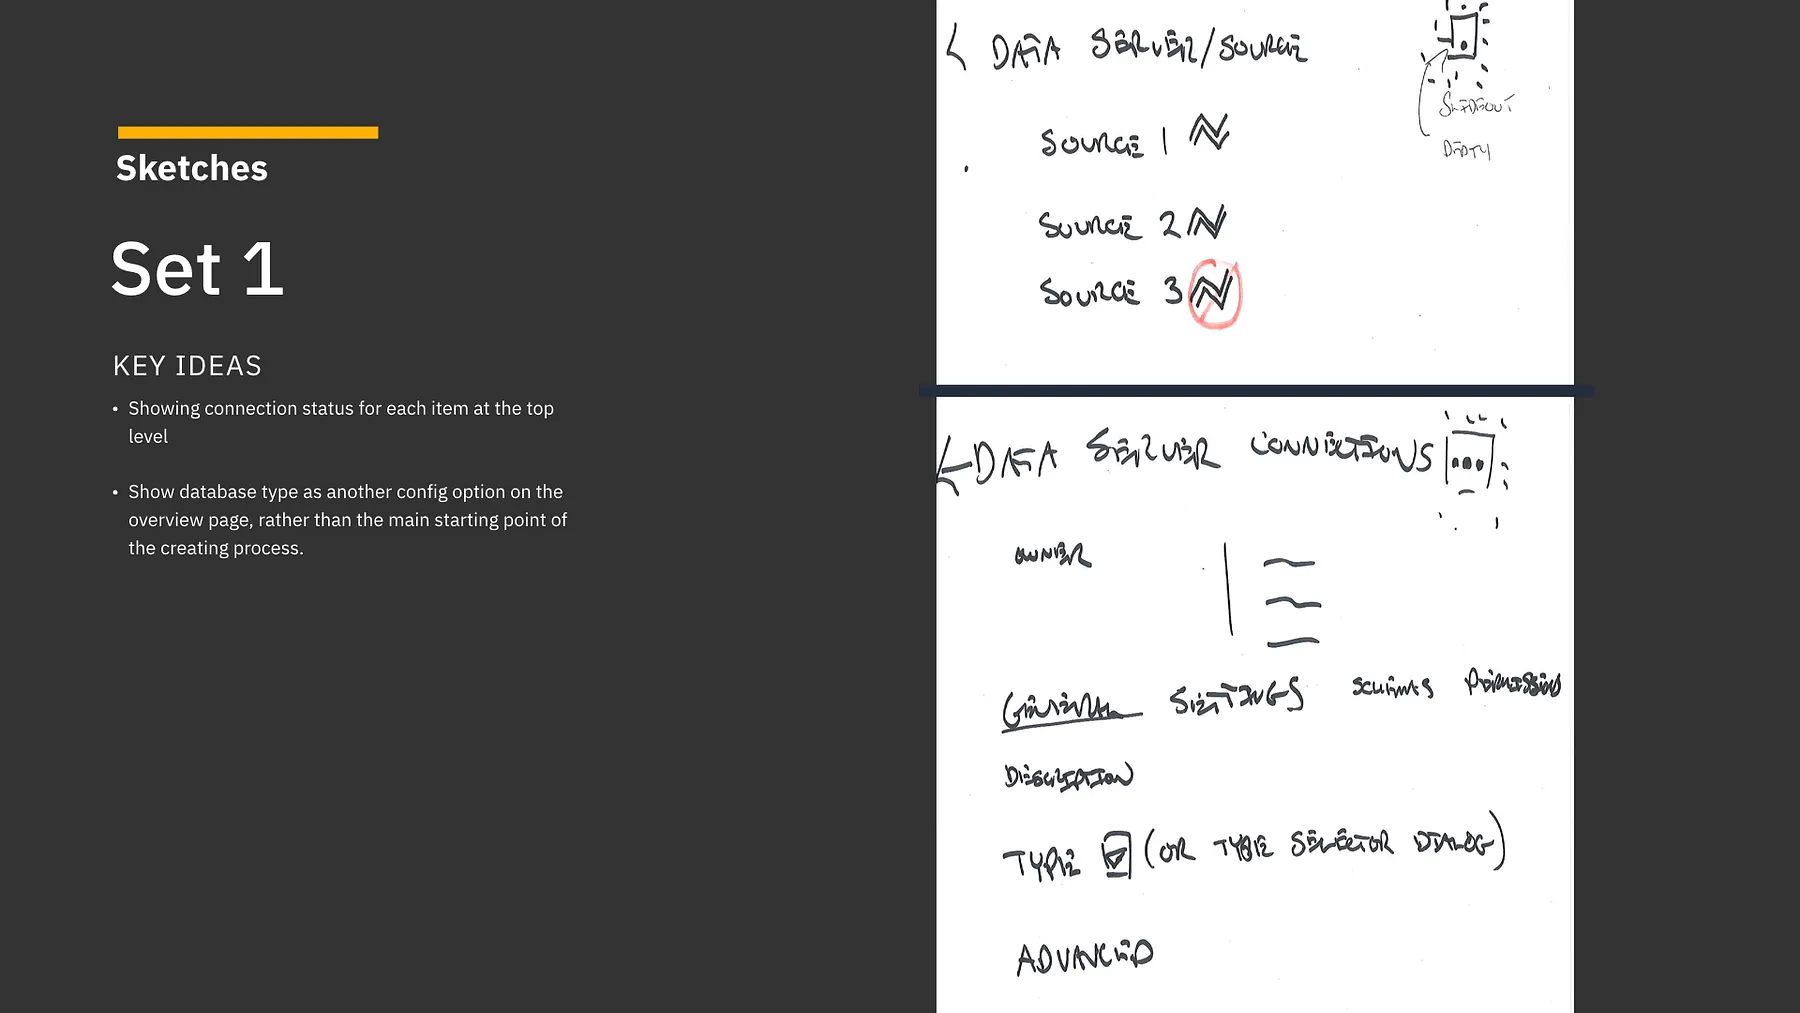
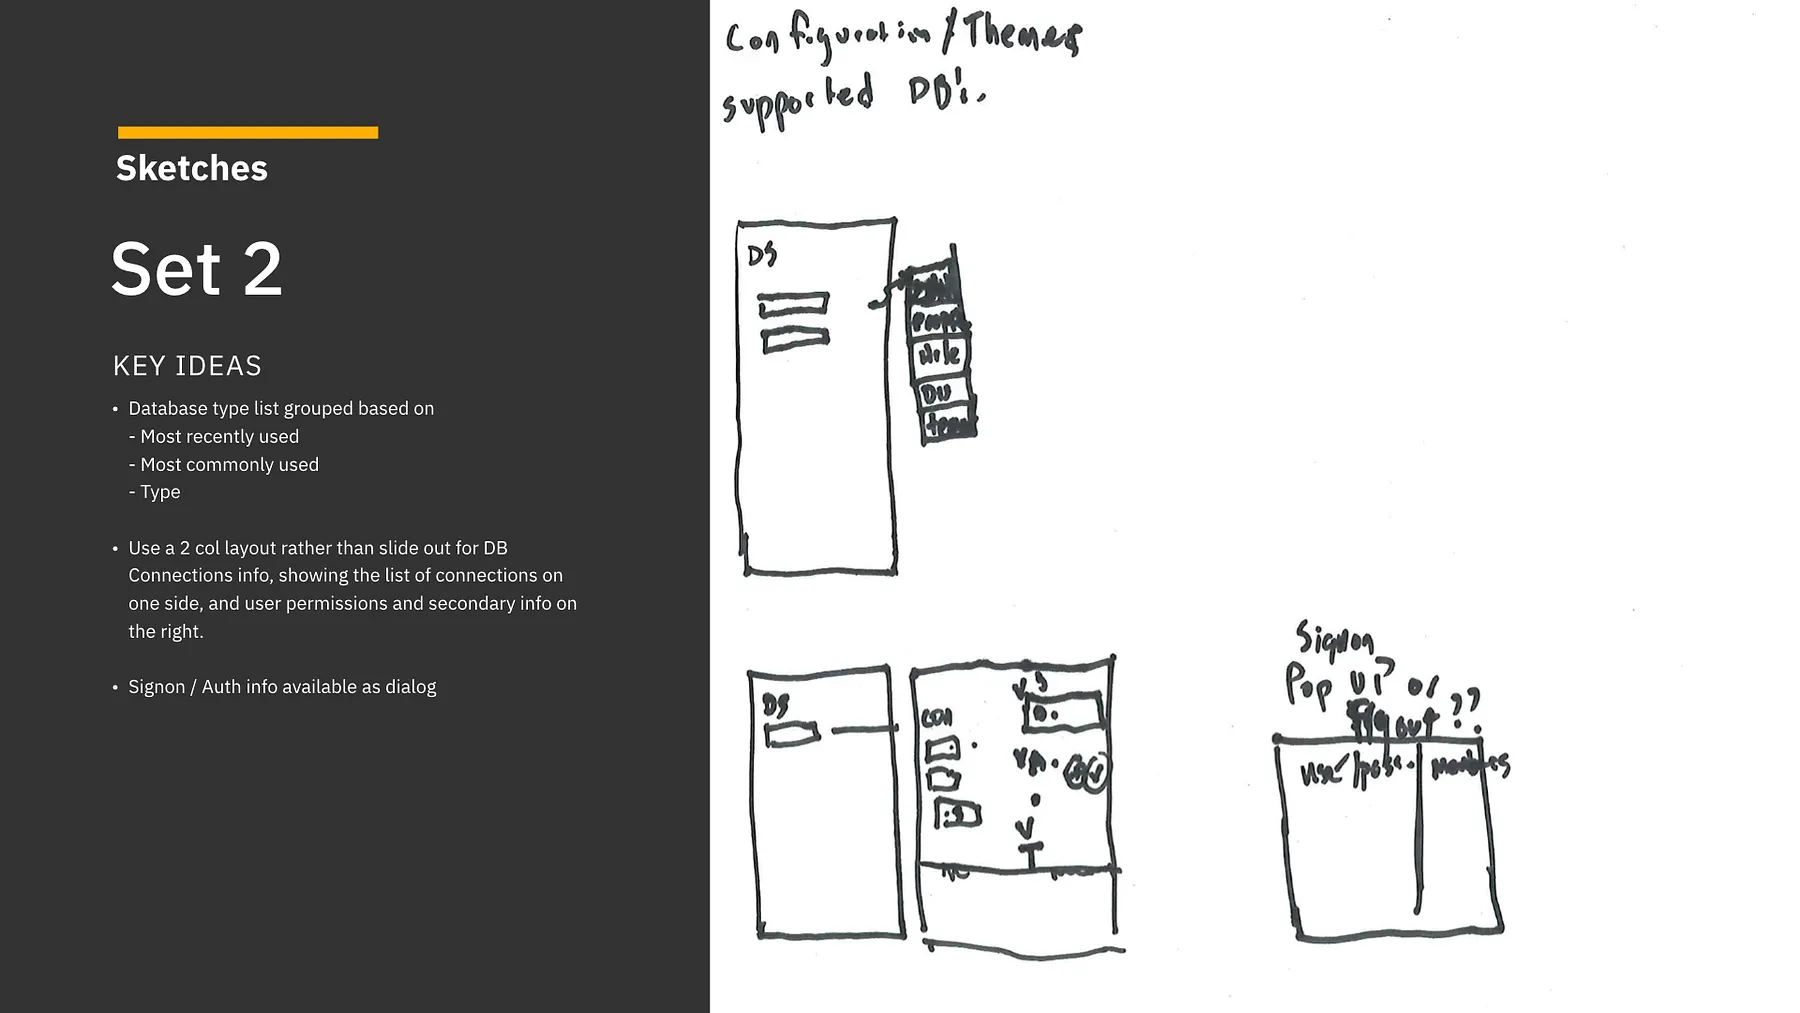
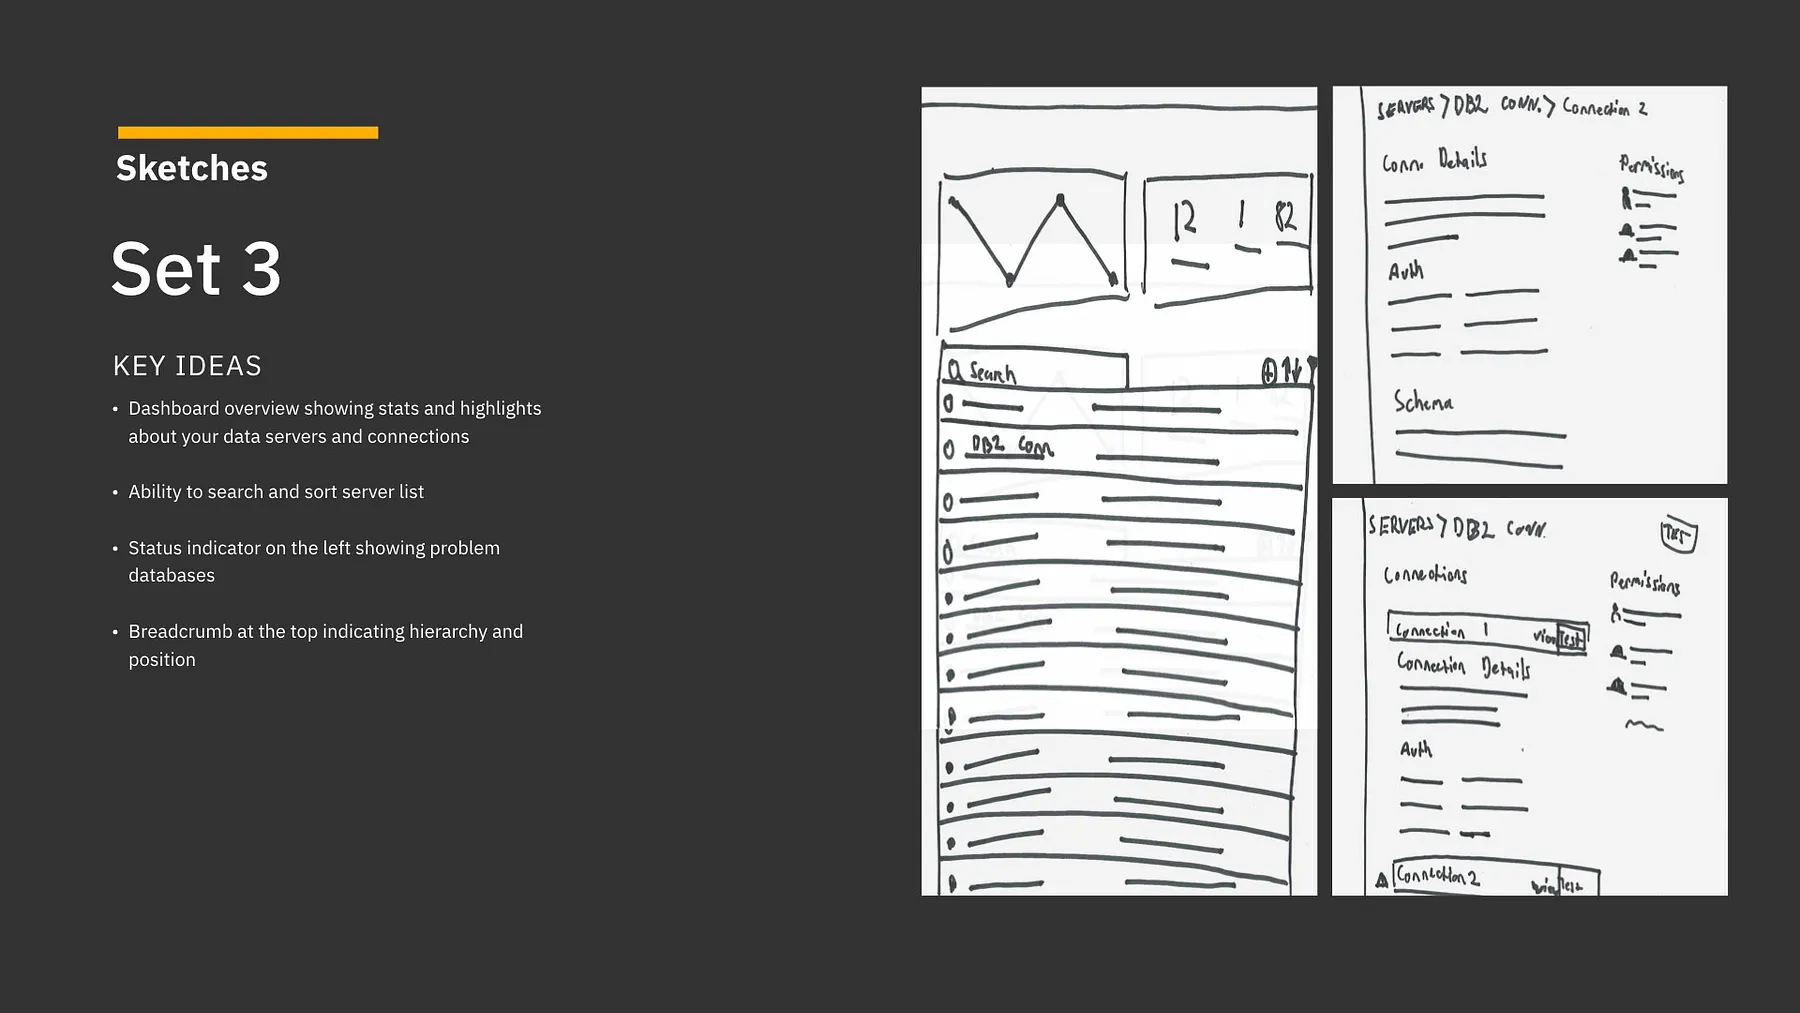
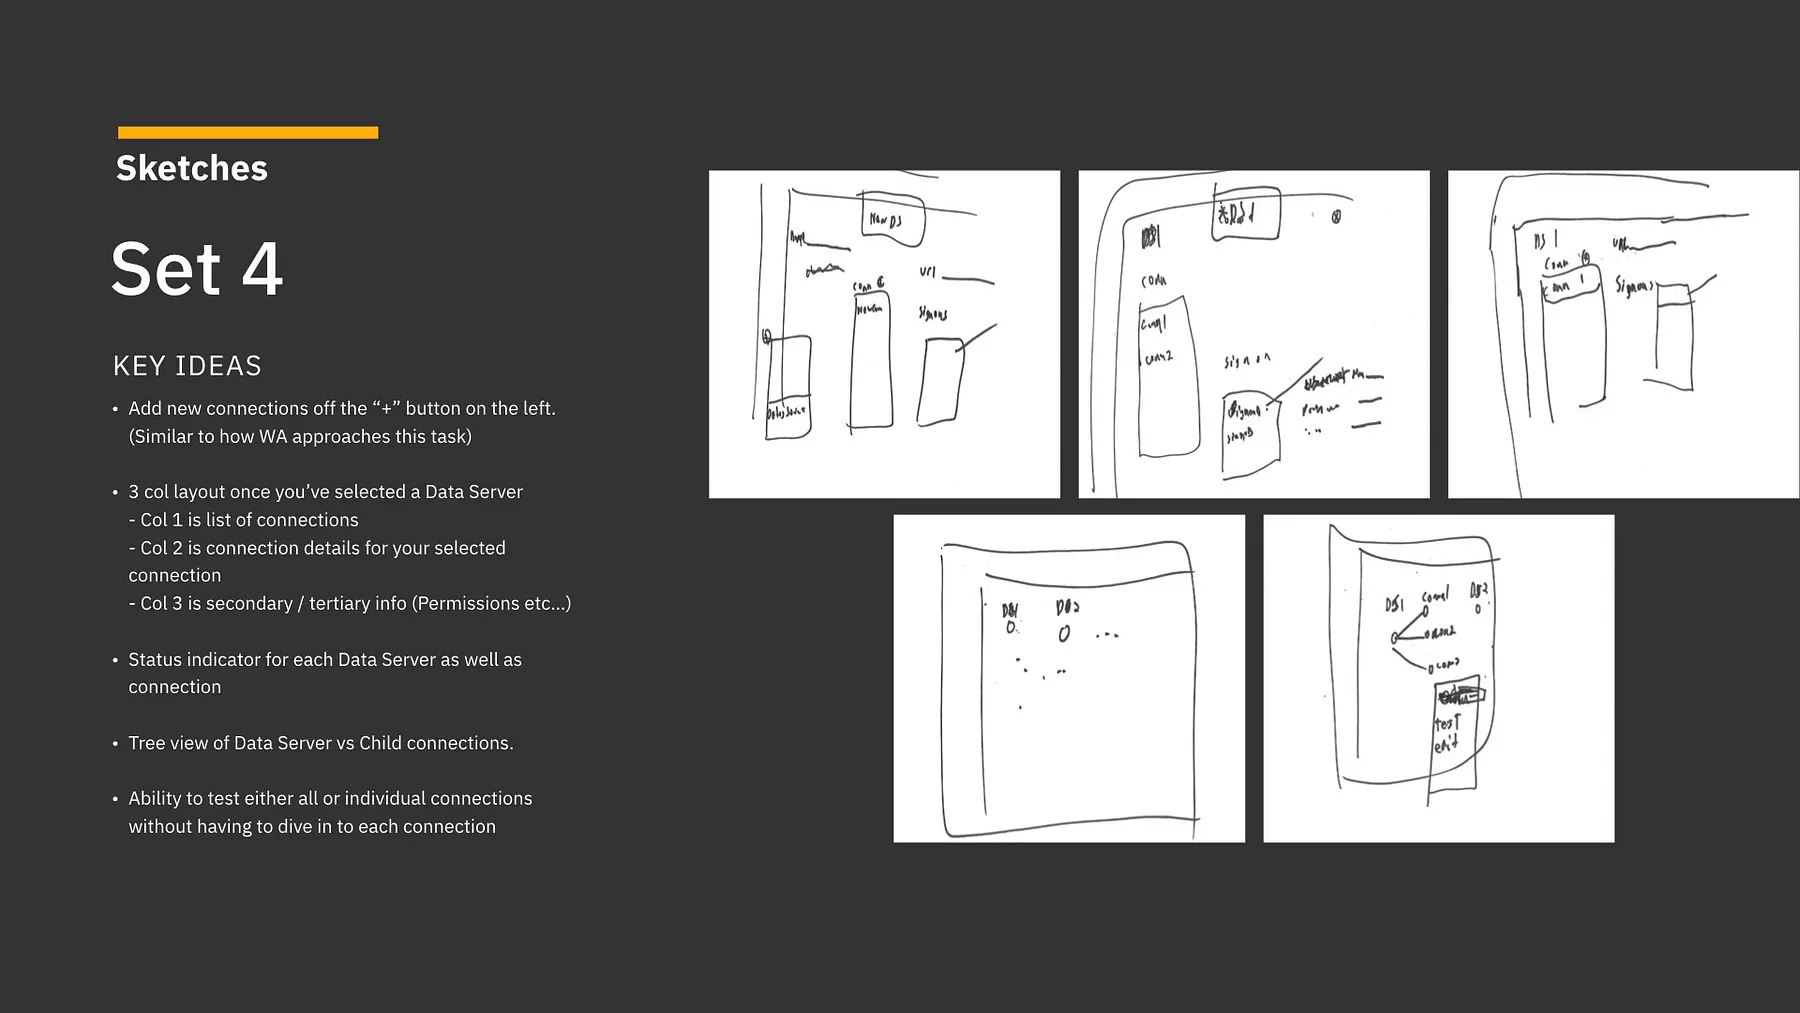
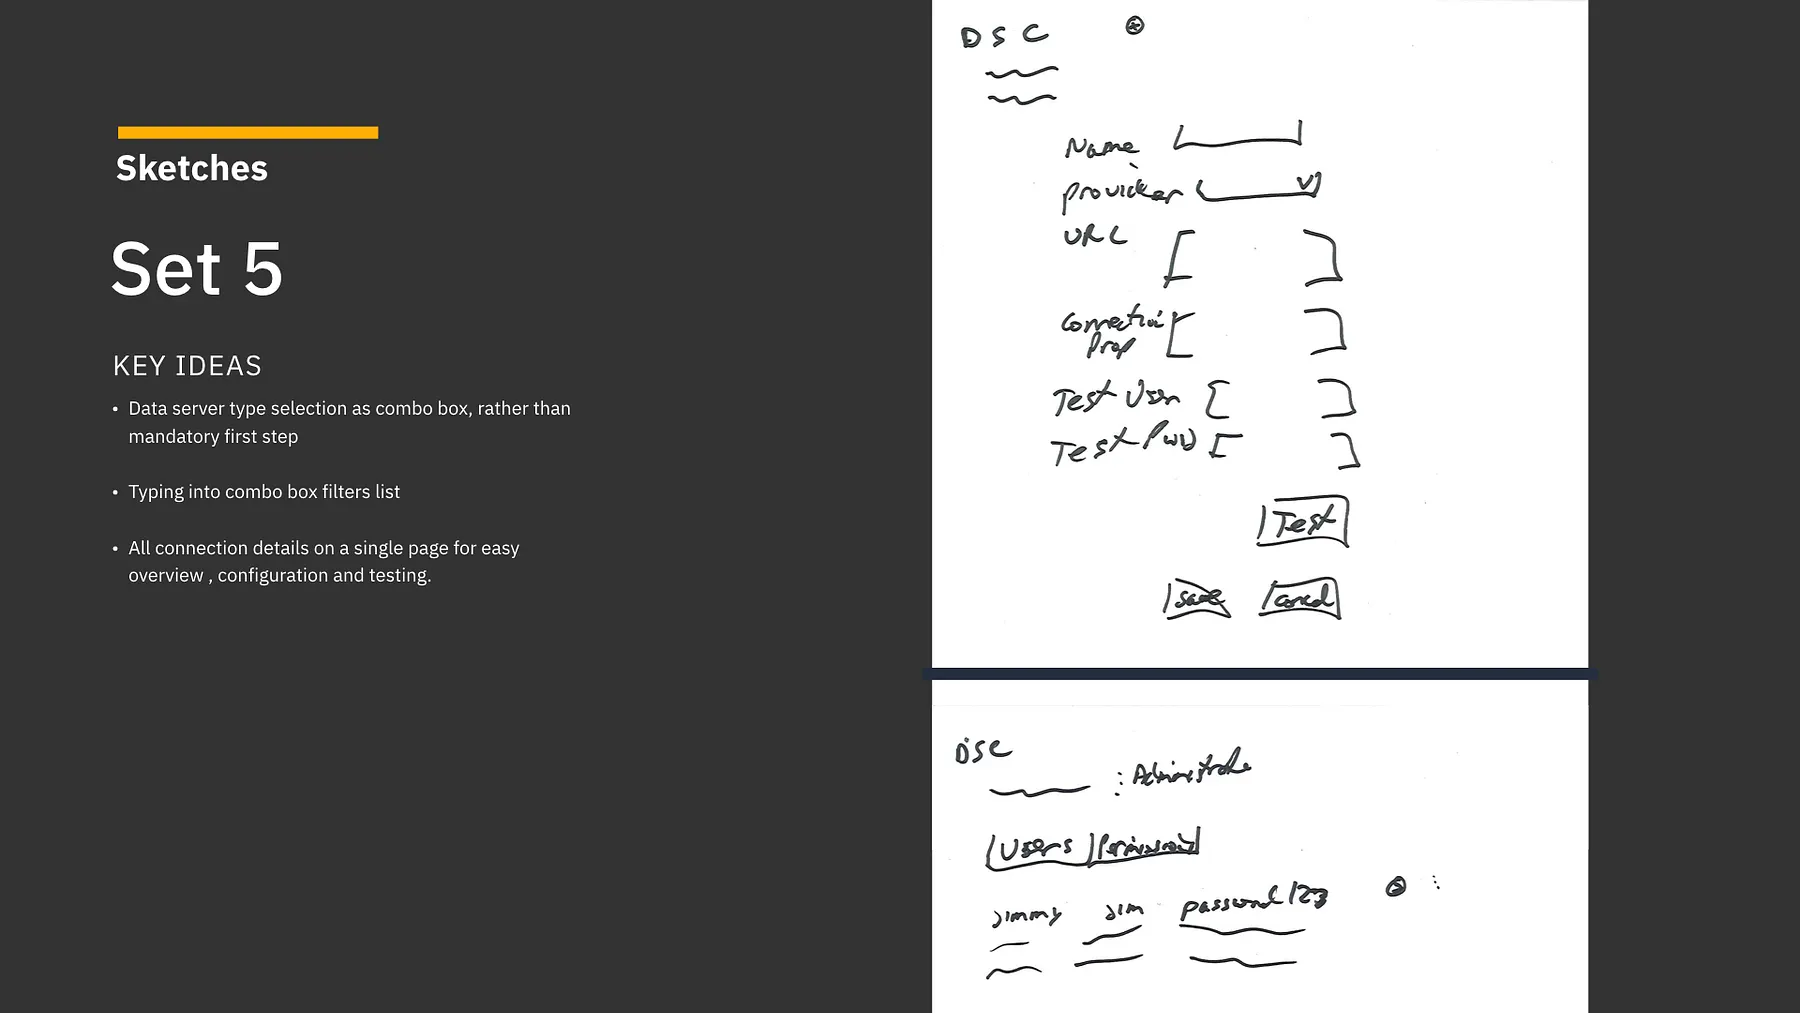
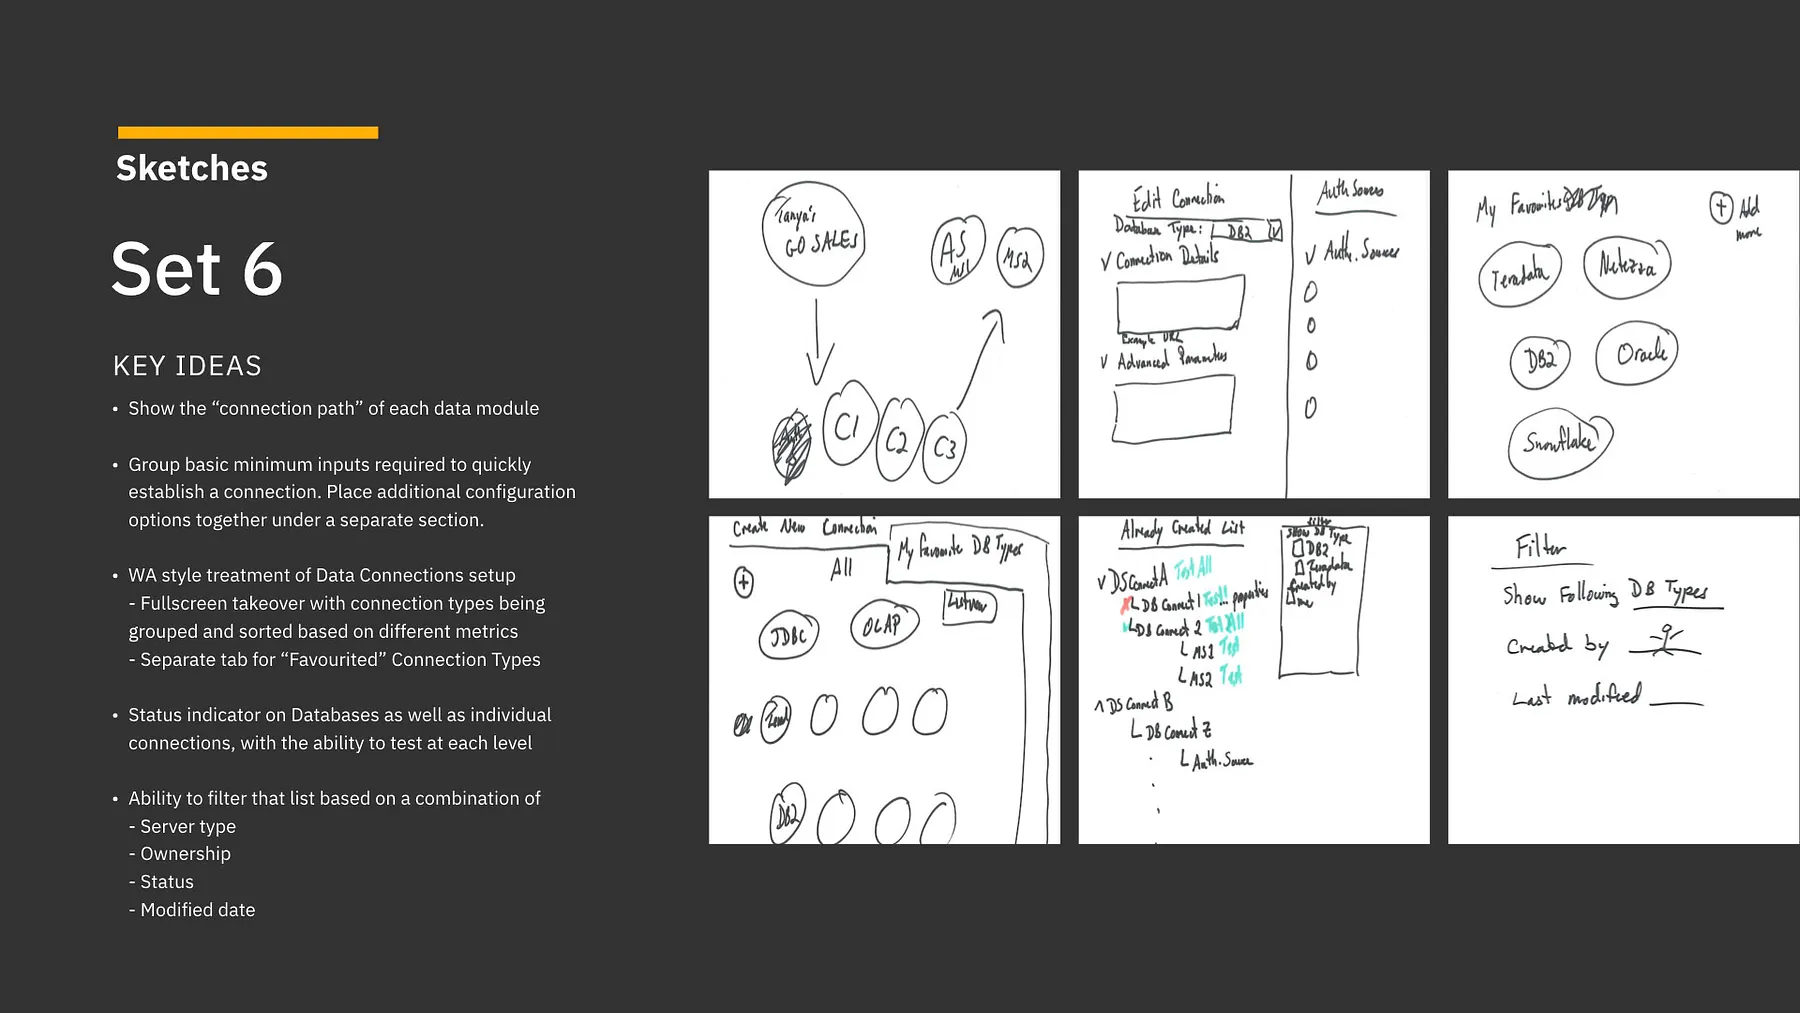
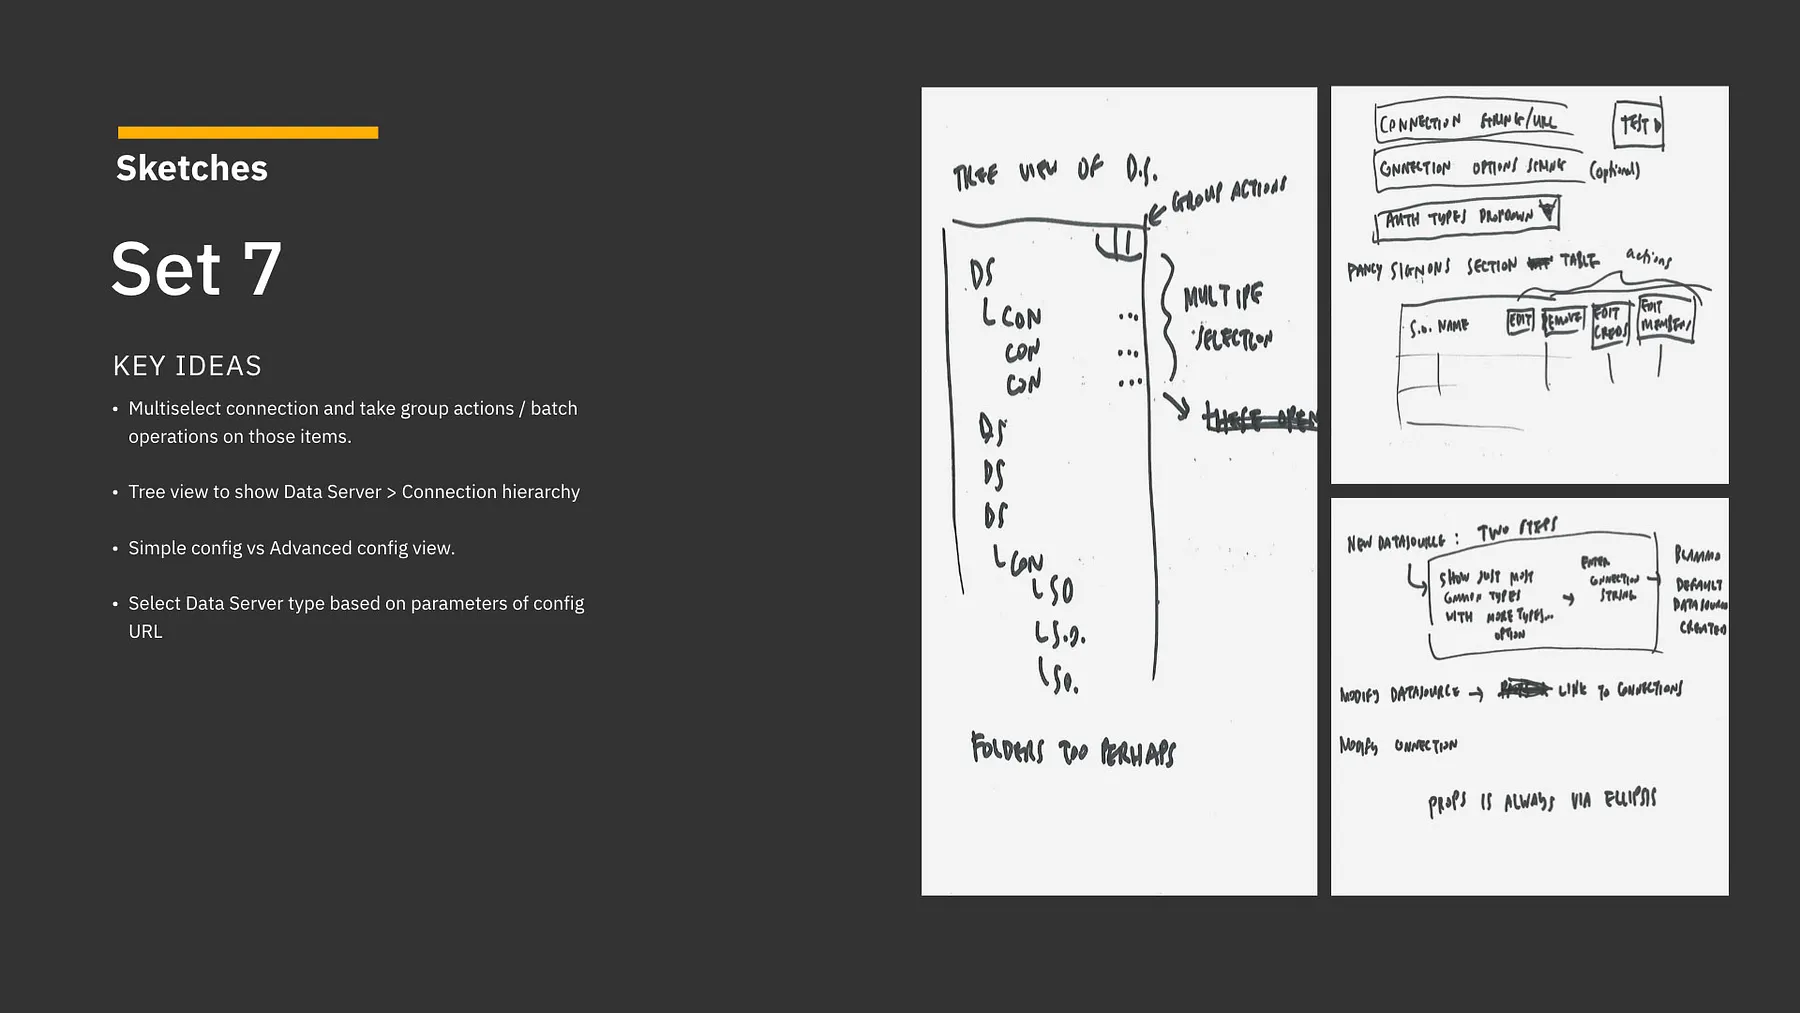
Every Design Thinking workshop I’ve been involved with has had one thing in common — all of them required a bit of improvisation as we went along… and this was no different.
I wanted to run a few more exercises before we got to sketching, but I only had a bit of time left. Instead, I decided leverage the team’s enthusiasm and give everyone an opportunity to get their ideas down and share them with others.
This was one of the best examples for why having a diverse set of perspectives on a team and giving them a voice during the design process can be so beneficial. As designers, we’re responsible for the final outcome, but no one has a monopoly on good ideas. These sketches gave me a lot of great material to work, and gave others on my team a sense of ownership in the design itself.
Wireframing
Over the next few weeks we began to converge and flesh things out in more detail. I broke things down to the following views:
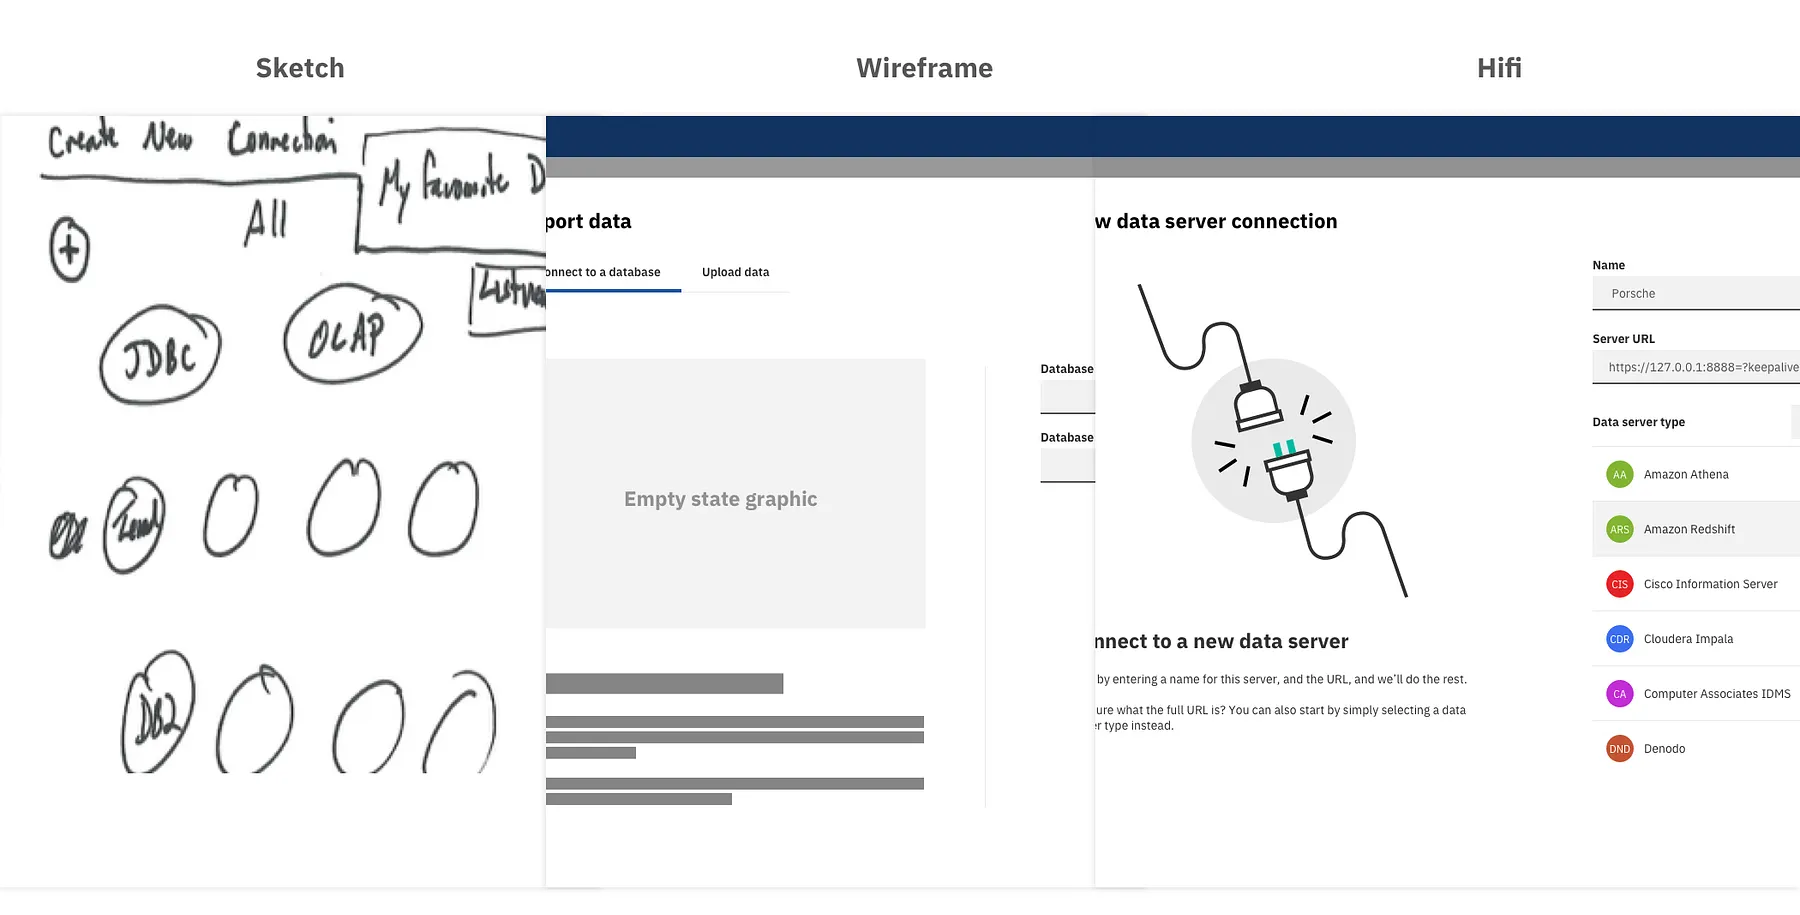
The New Connection View
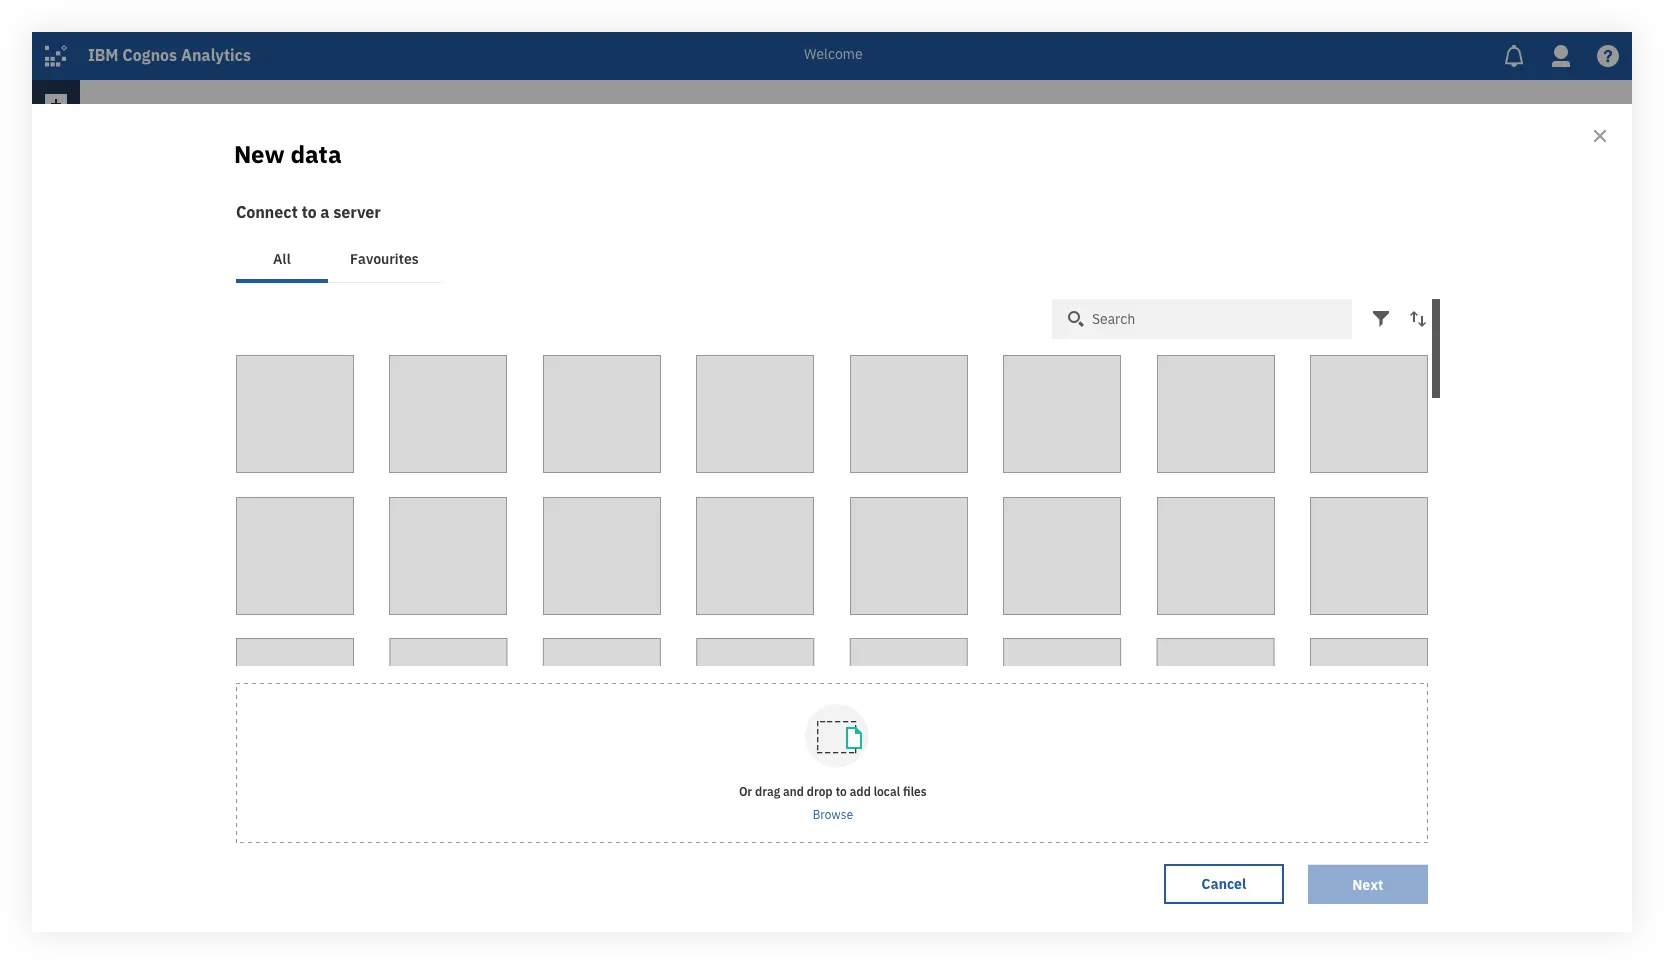
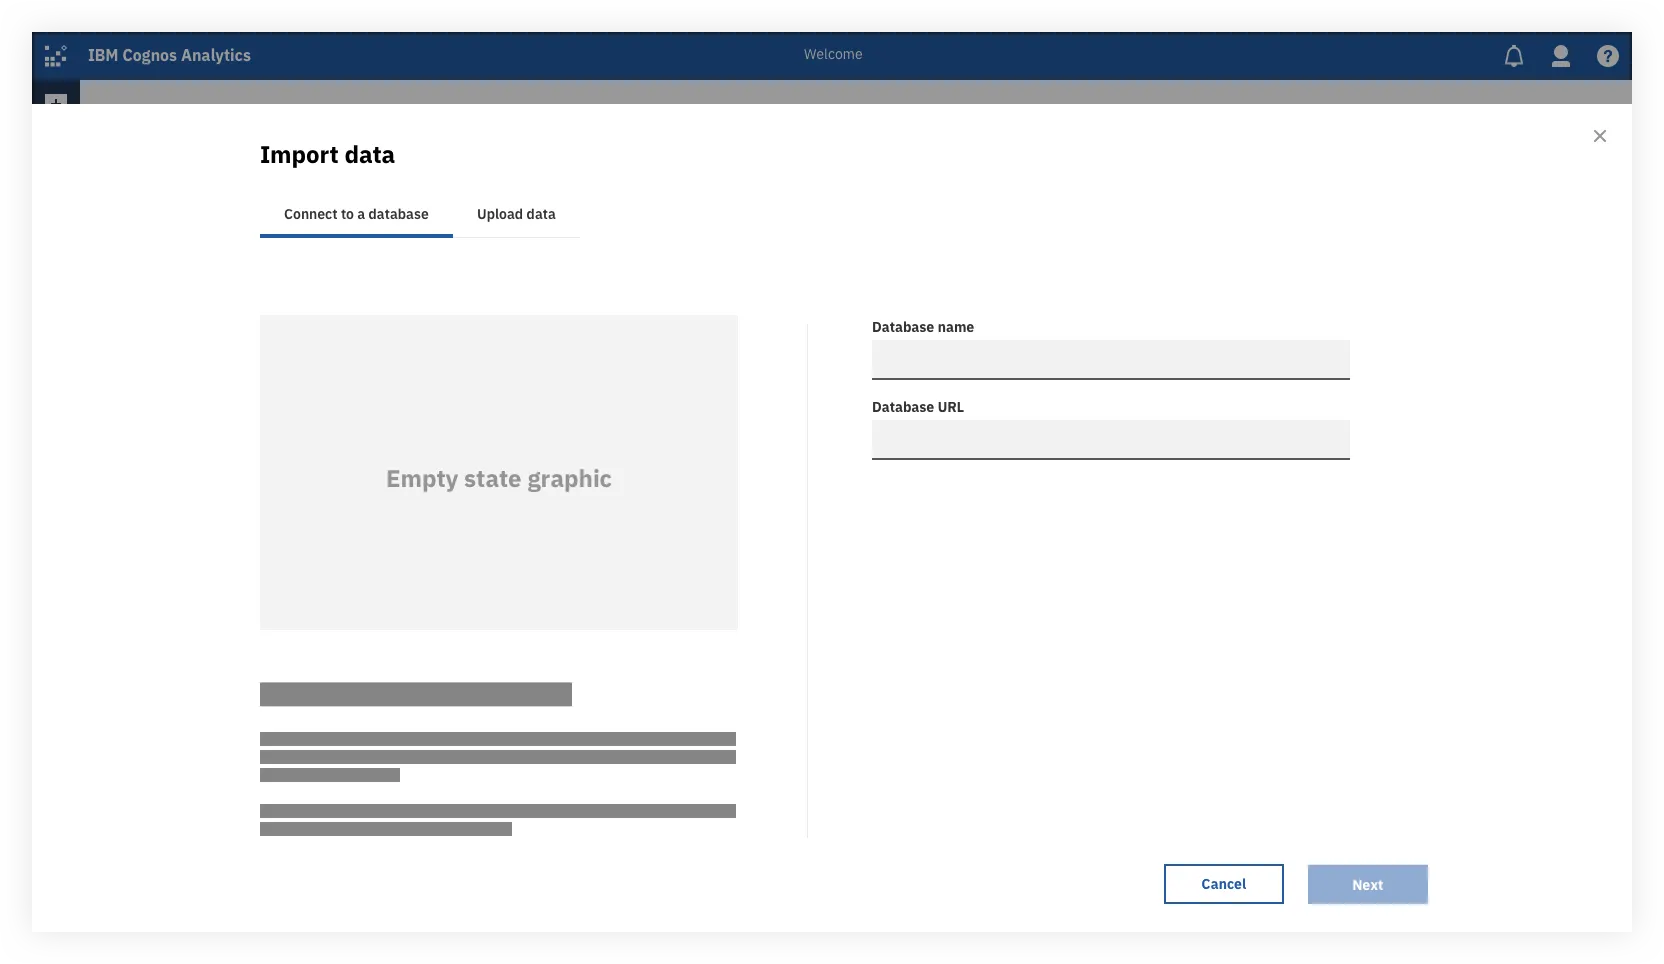
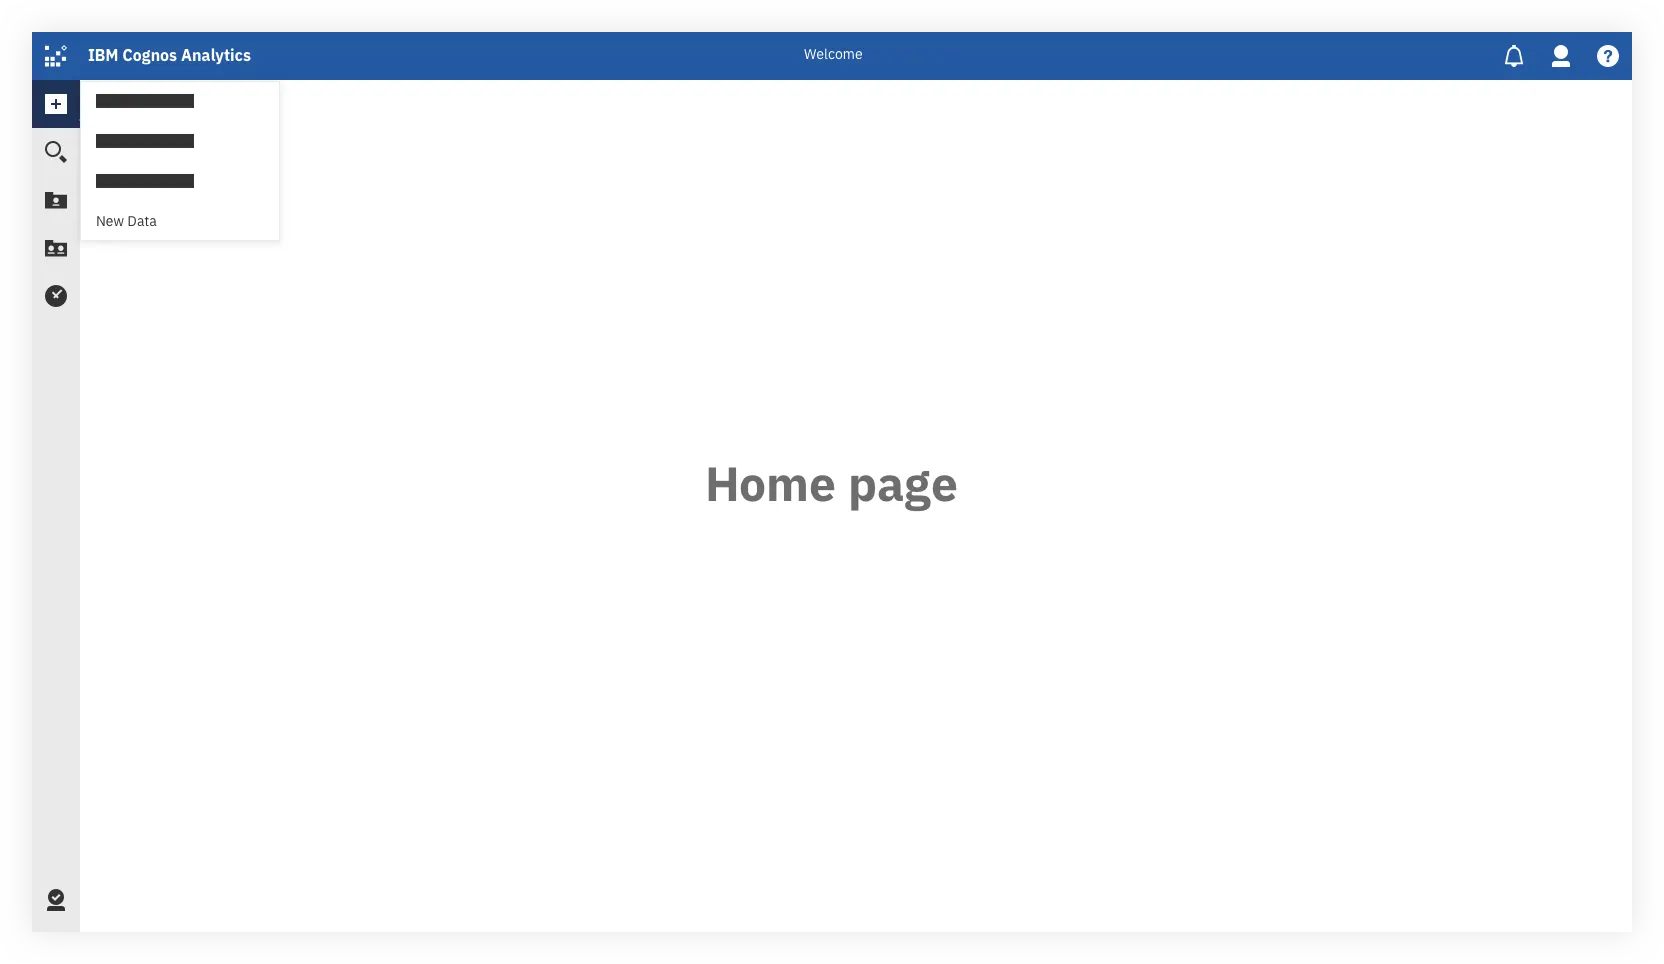
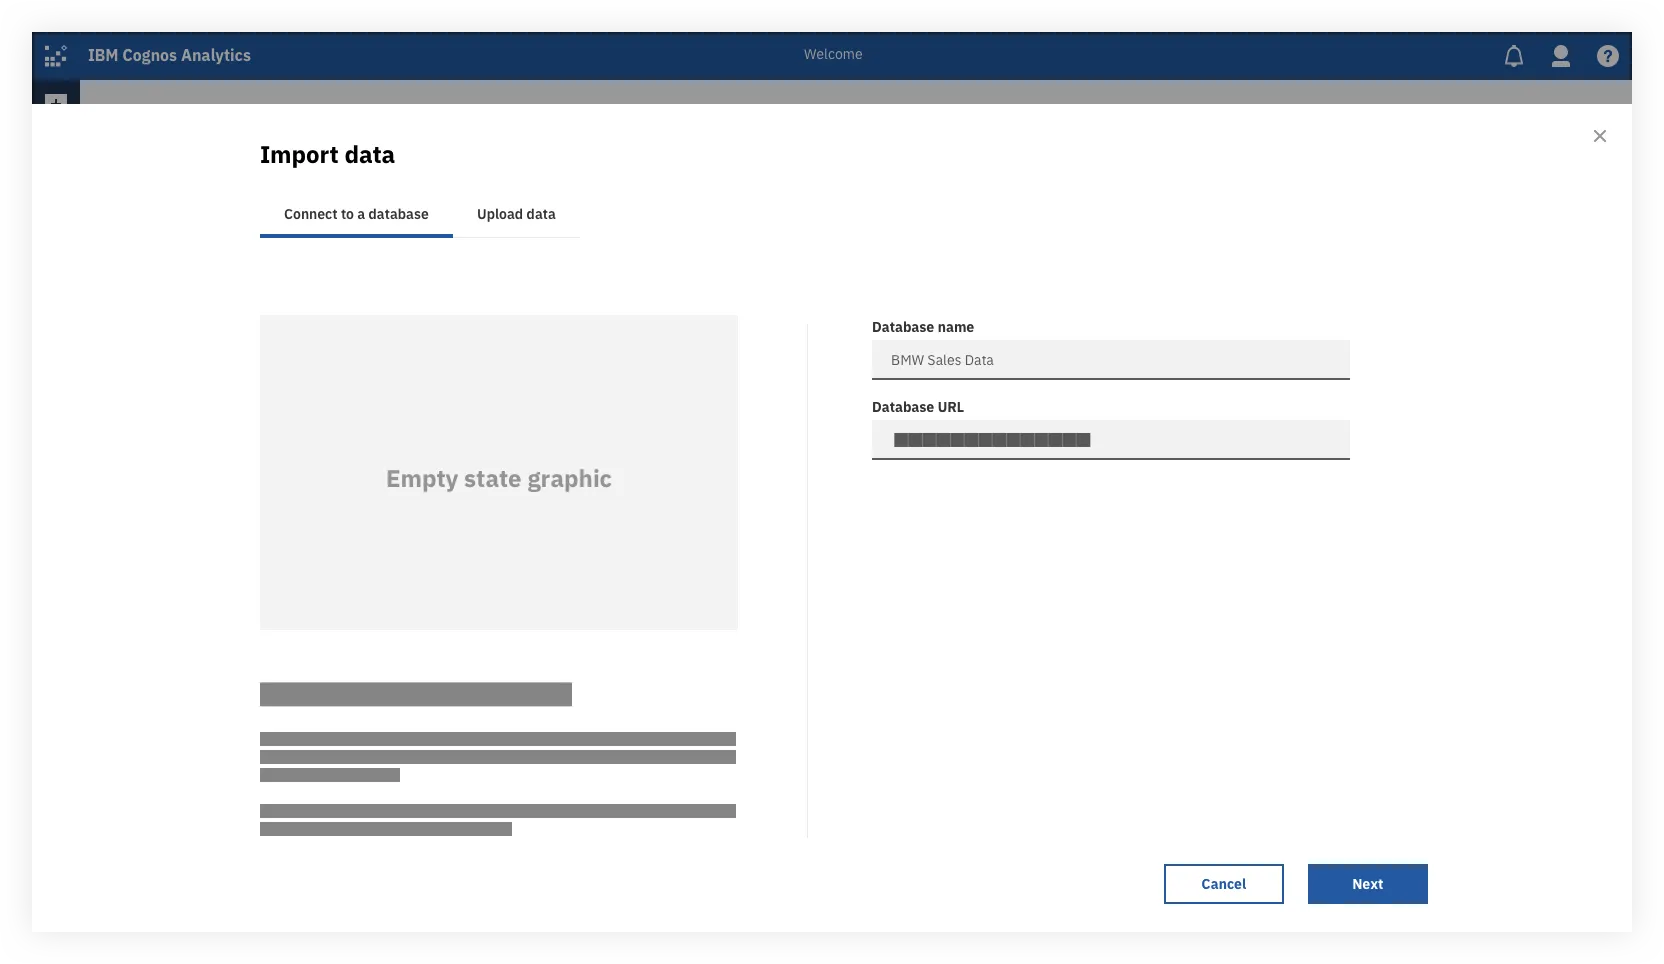
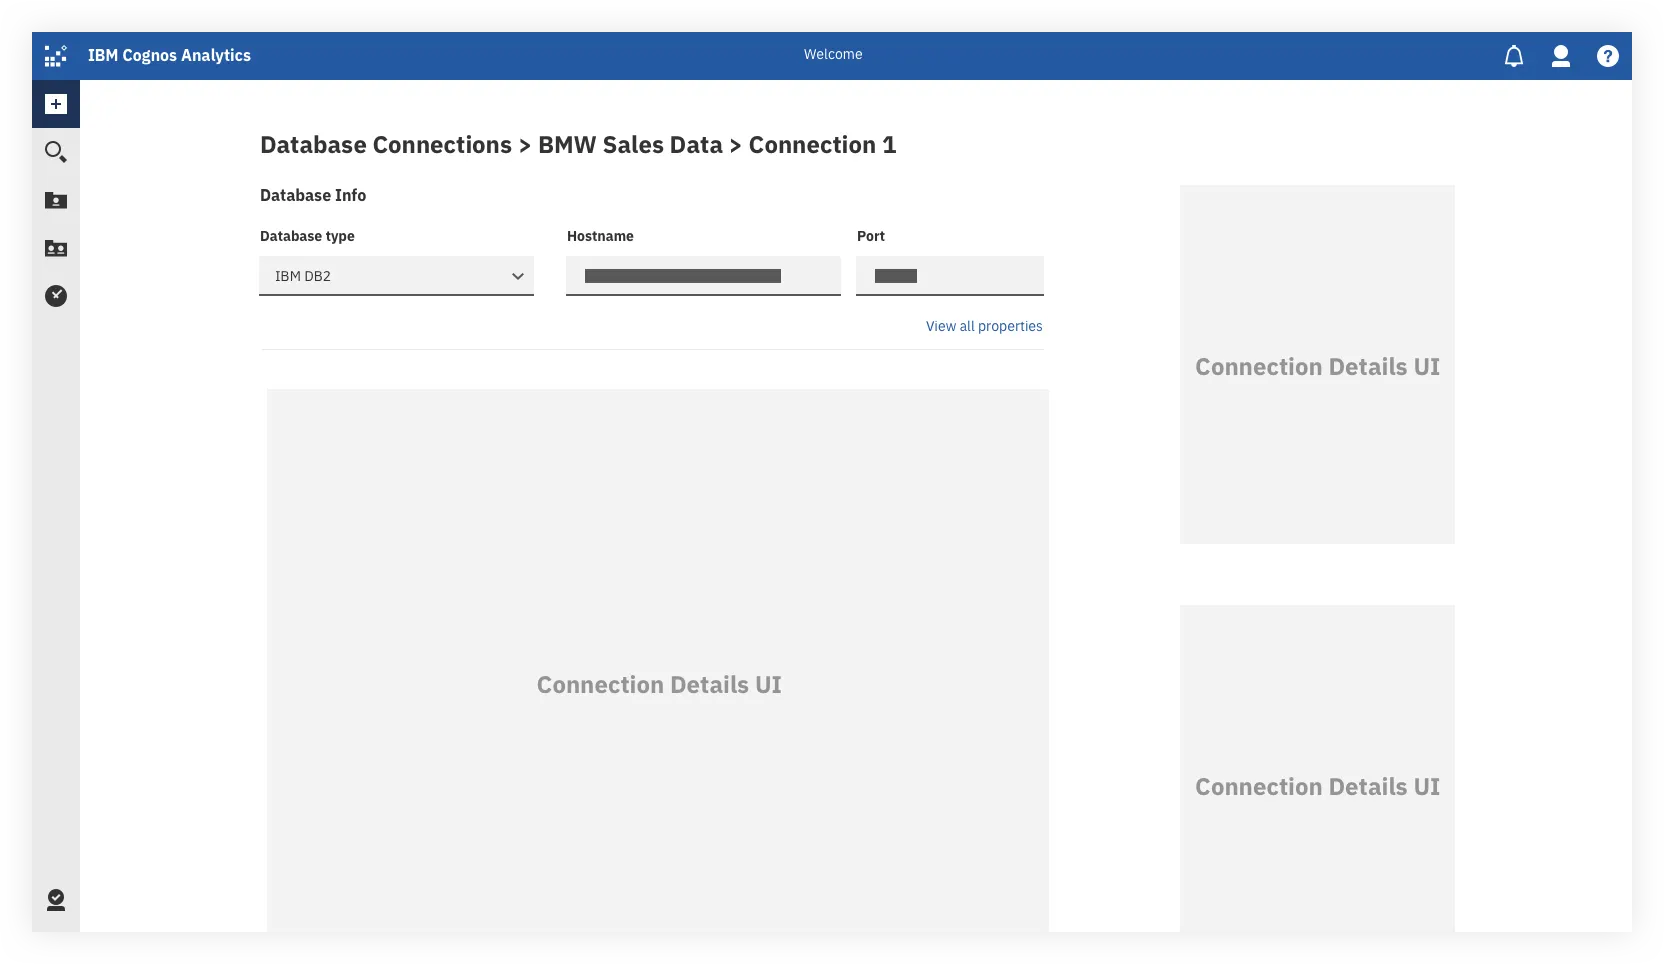
The user would be able to invoke this view as an overlay from a few different places in the UI. The main one being the Plus button at the top which we currently use to create new assets in Cognos and add in data files. This helps update our current experience to be more streamlined for analysts, who’d no longer have to go into the admin panel to set up new connections.
The Servers List
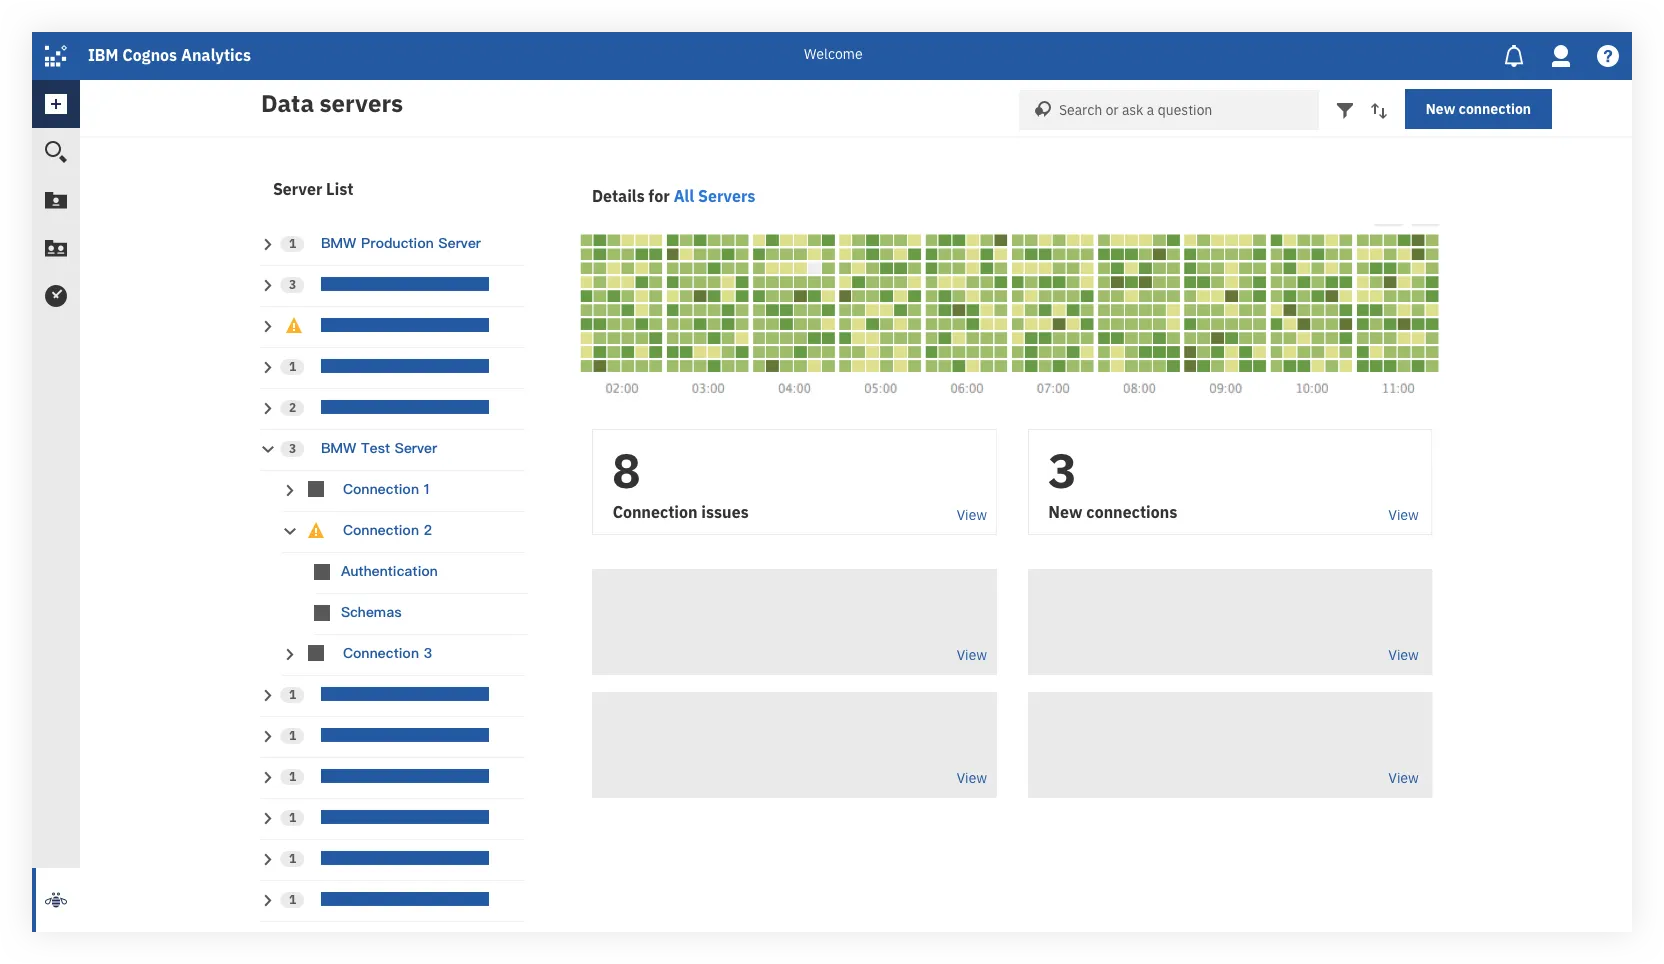
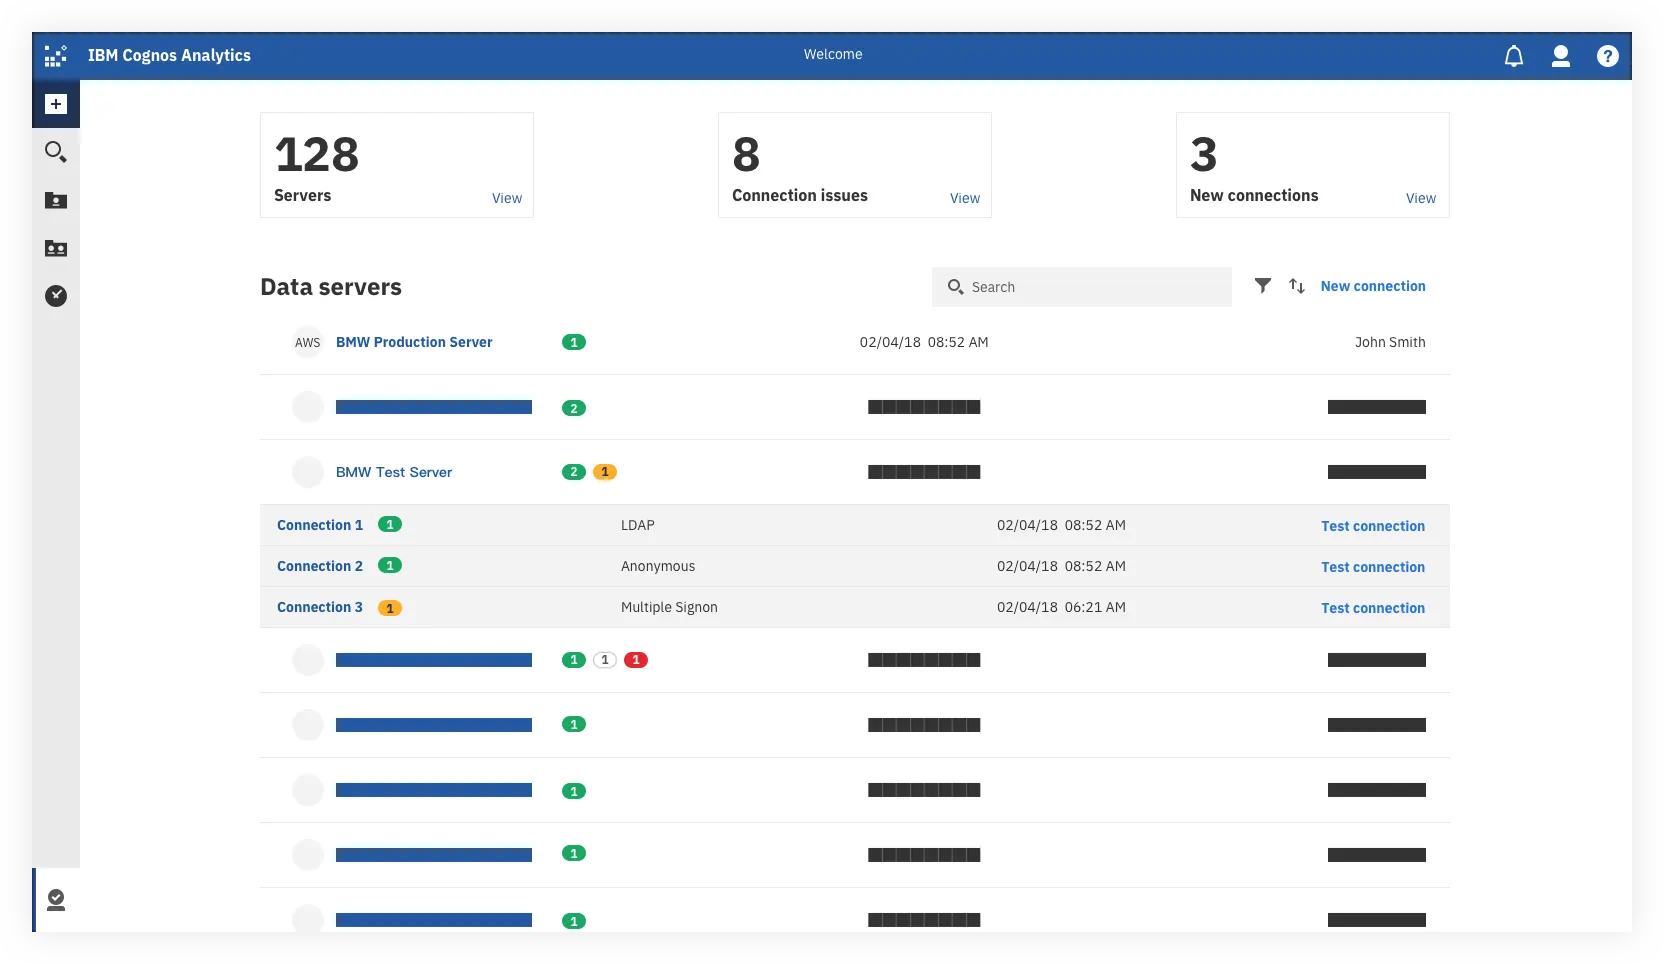
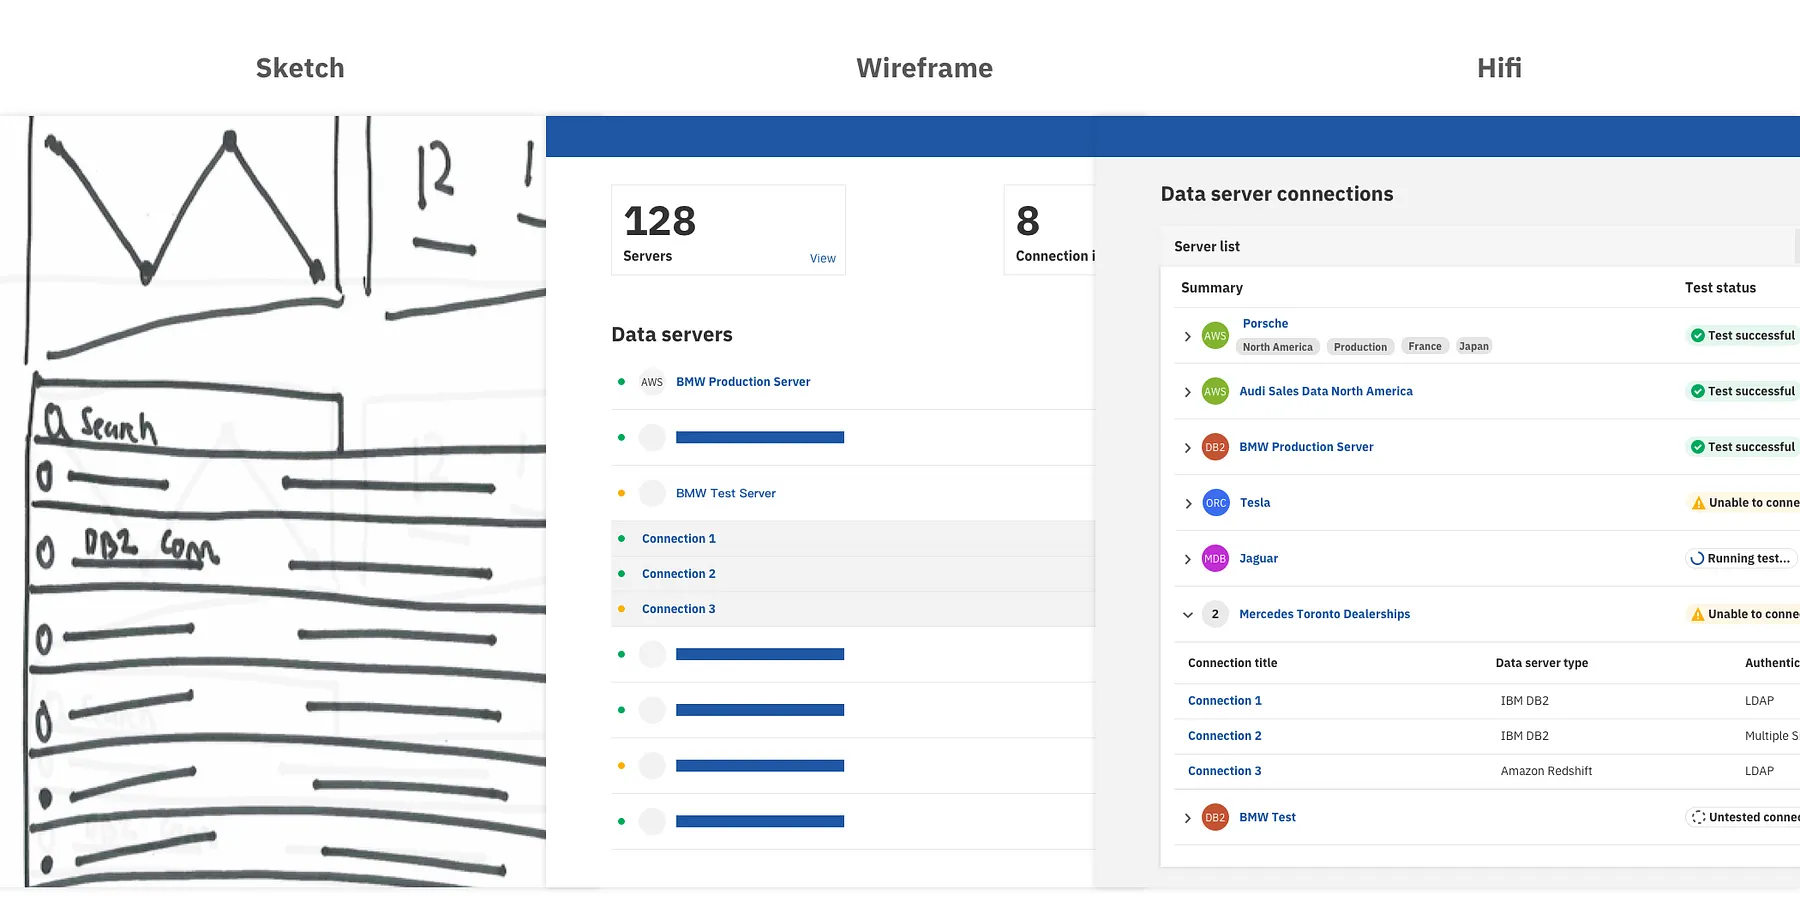
We explored different layouts and indicators to show the hierarchy and relationships between Servers and Connections, while providing high level information about each item that the users could take action on.
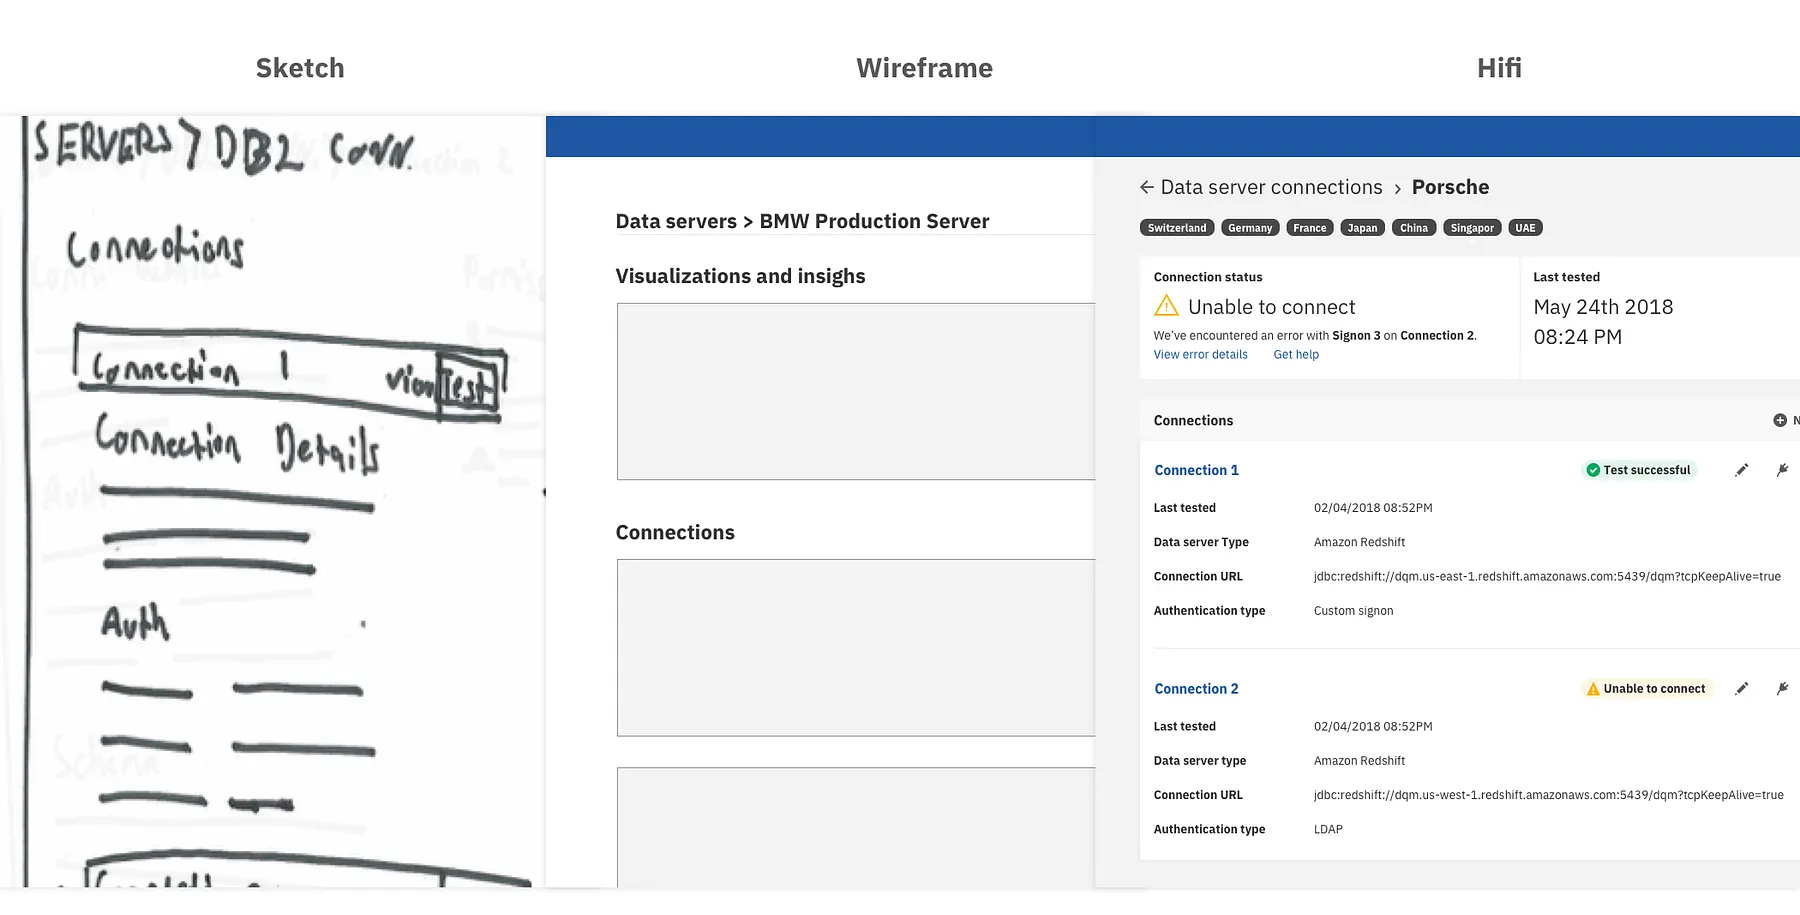
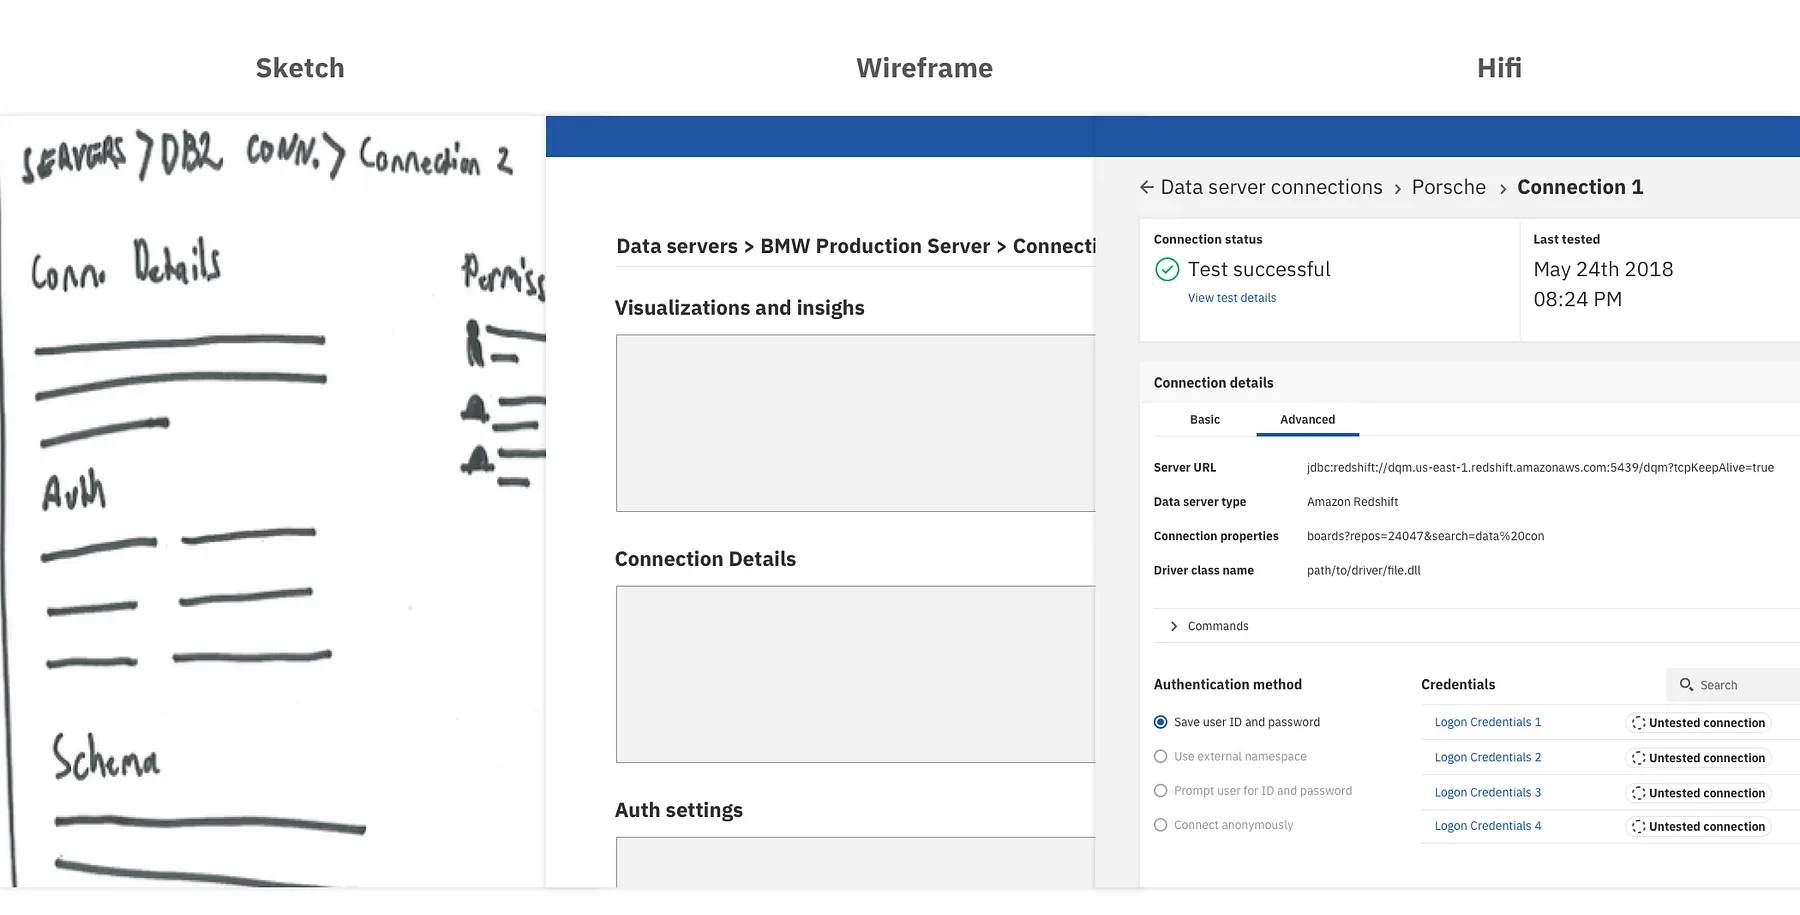
The Server Details, Connection Details and Authentication Details Views
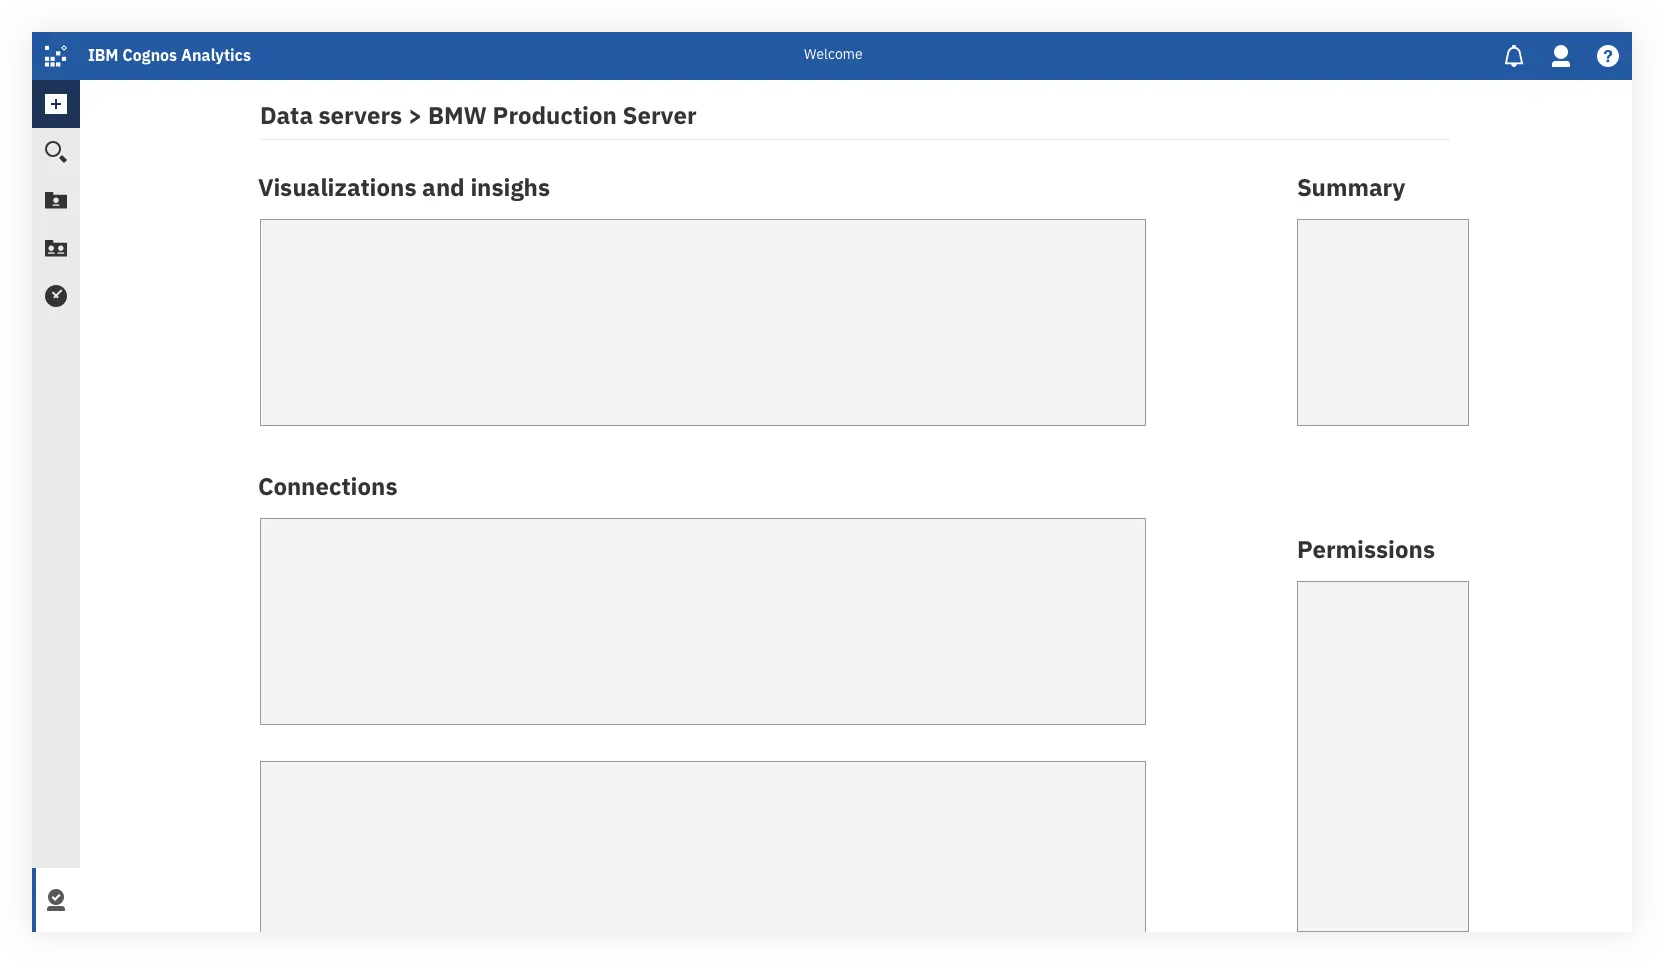
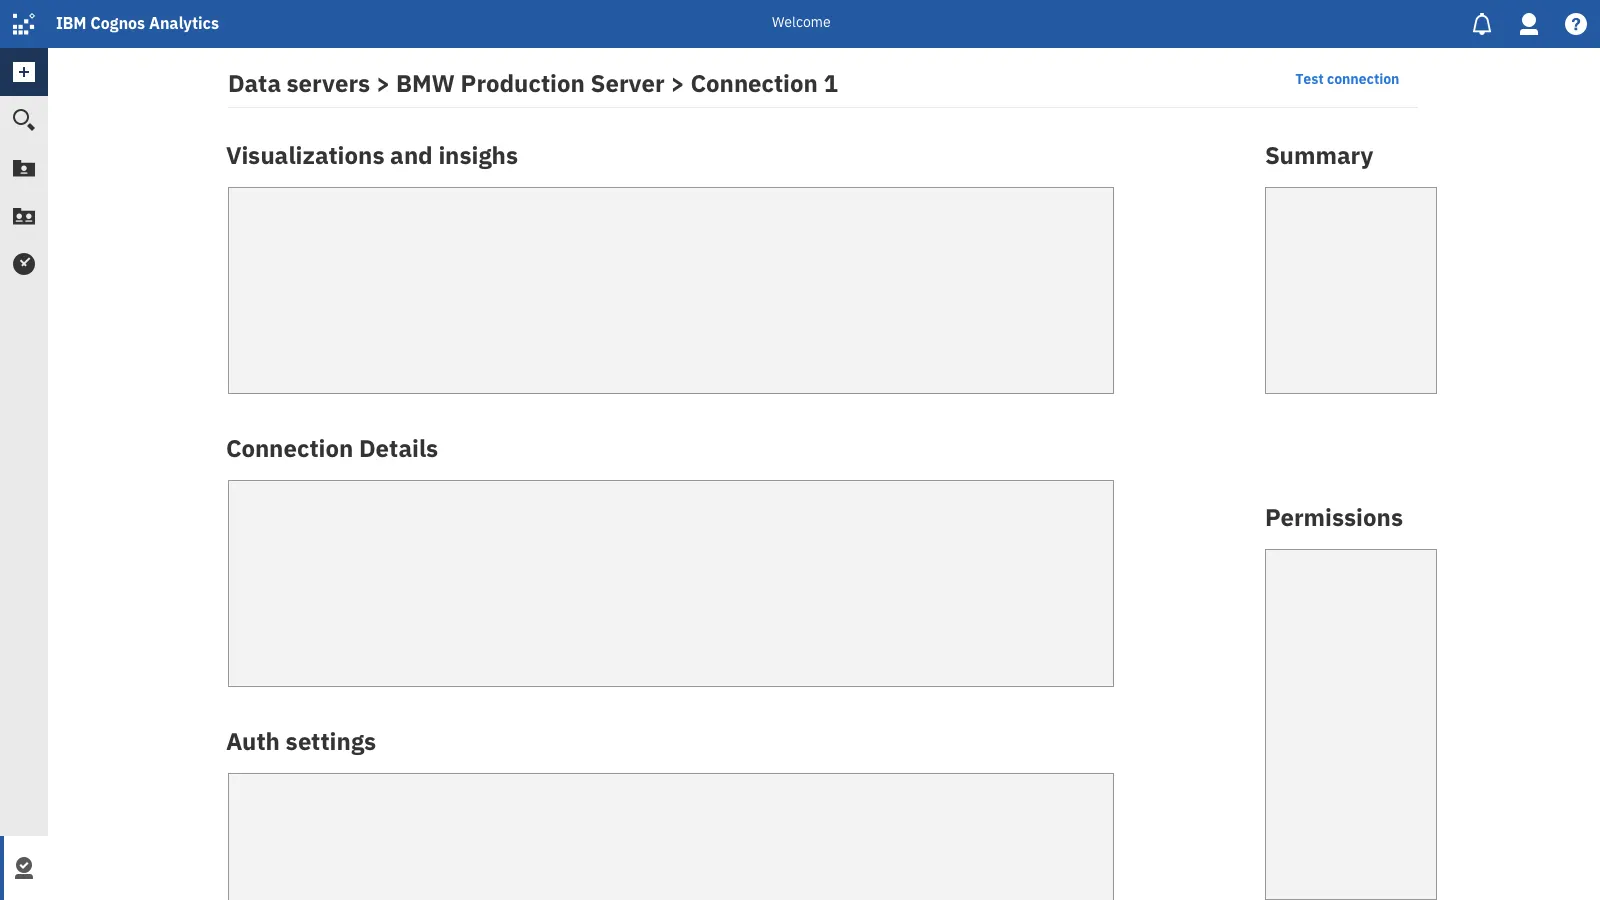
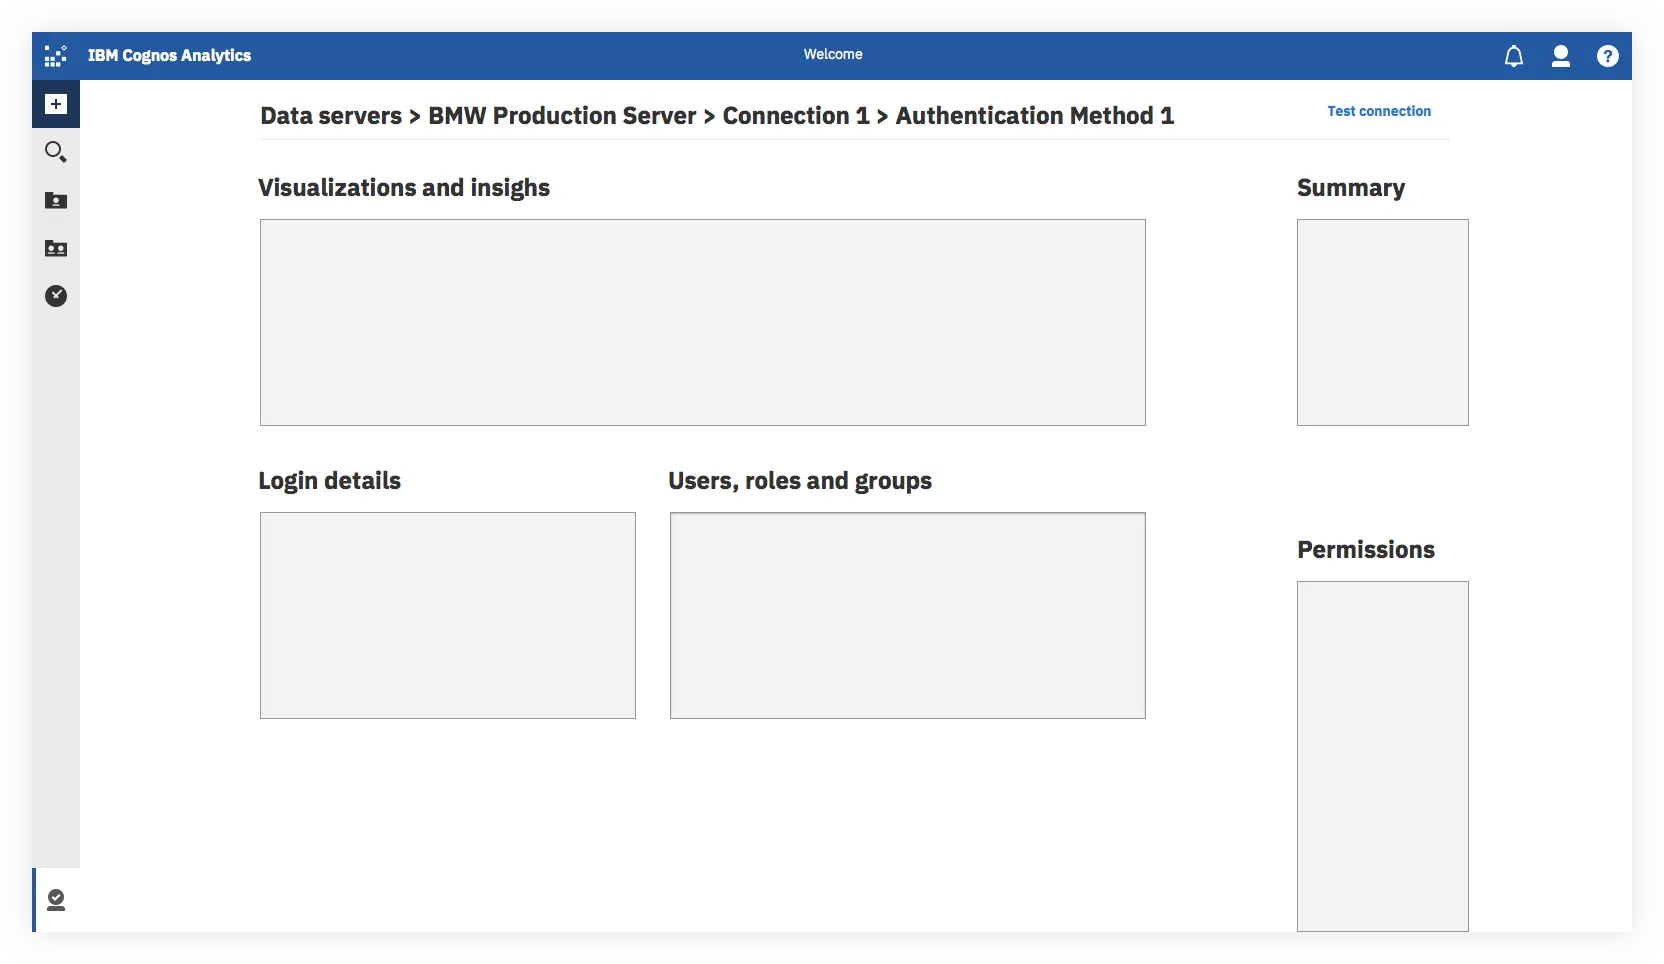
For these screens I decided to focus on mapping out general layout and information architecture, while my team gathered more detailed requirements.
Understanding the hierarchy and relationship between Servers, Connections and Authentication Methods is something users struggled with in the existing experience due to key parts of the UI being hidden behind tabs and links, as well as unclear directions, vernacular and calls to action. My goal was to clean up this hierarchy, clarify the wording and create a layout template that could be reused between the different levels in the IA to help create consistency and familiarity for the user.
HiFi Designs
We went through a number of iterations, meeting weekly with the core team to review and update, bringing in additional stakeholders and domain experts as needed.
The New Connection View
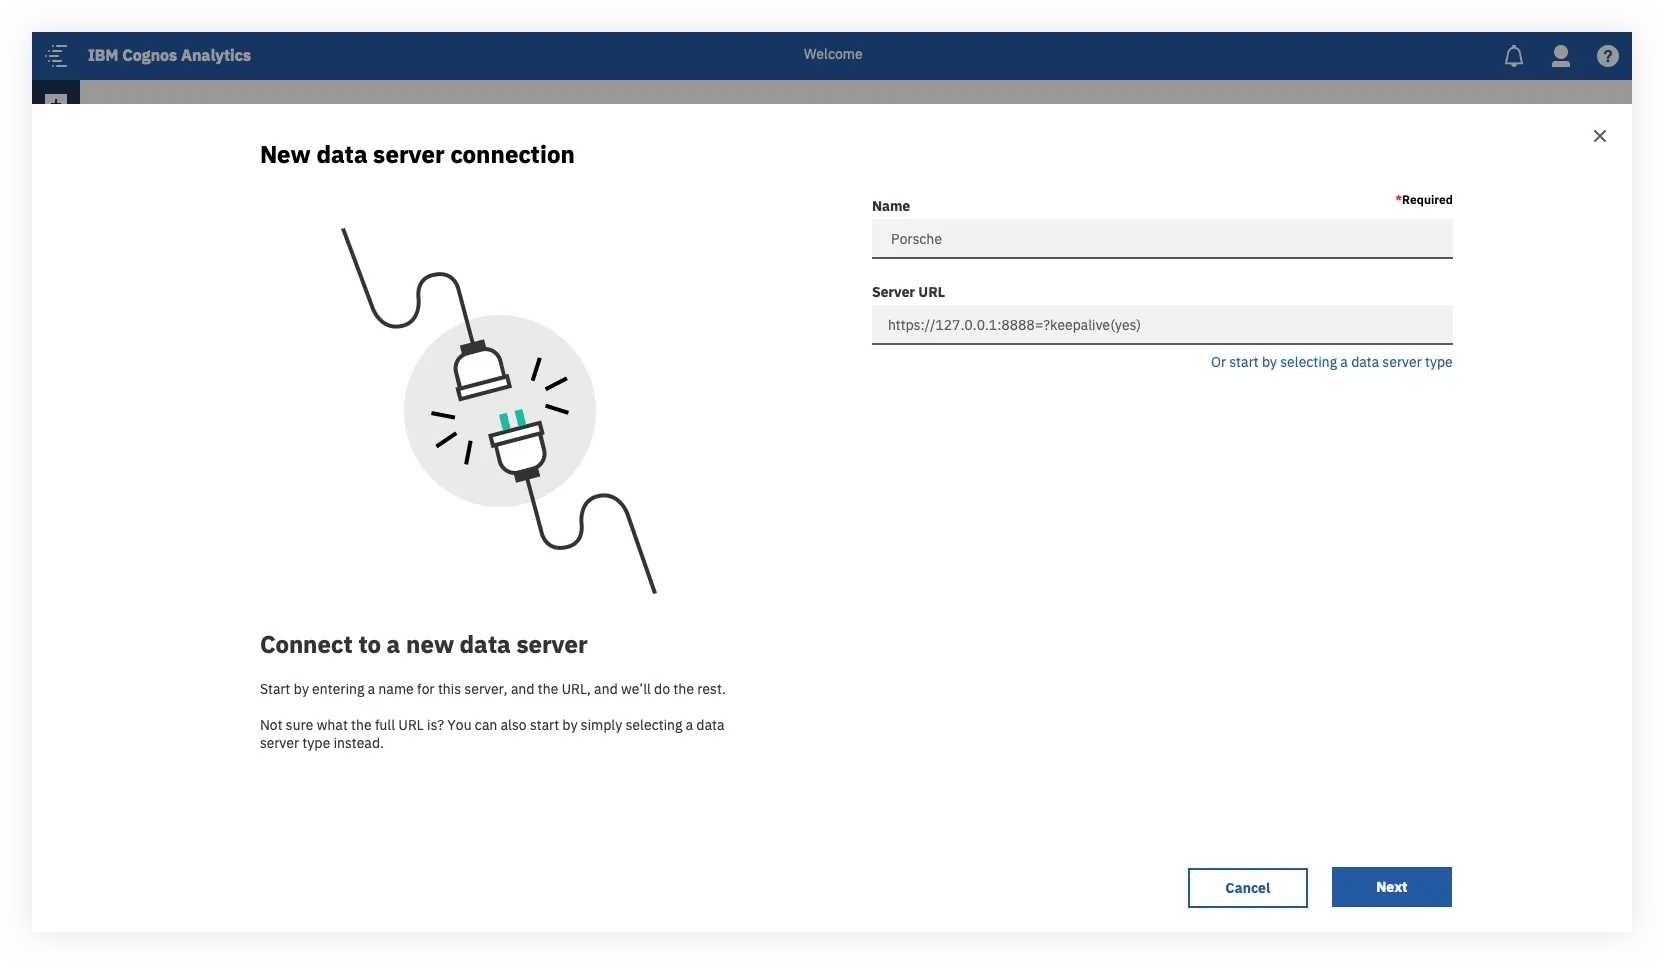
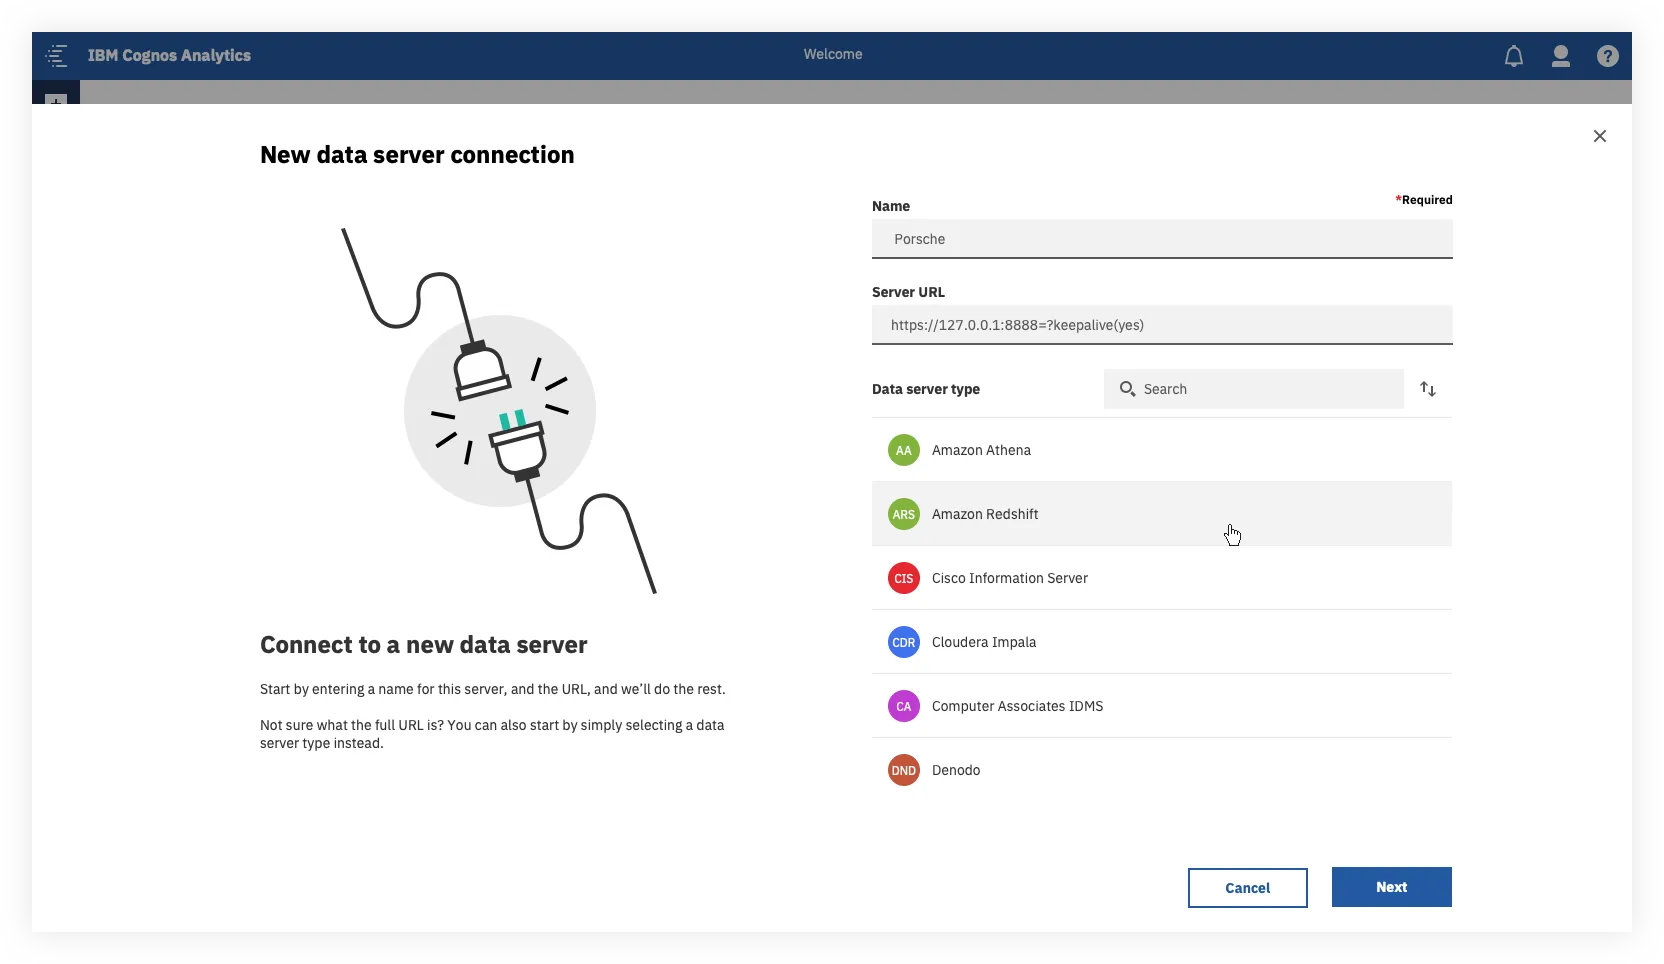
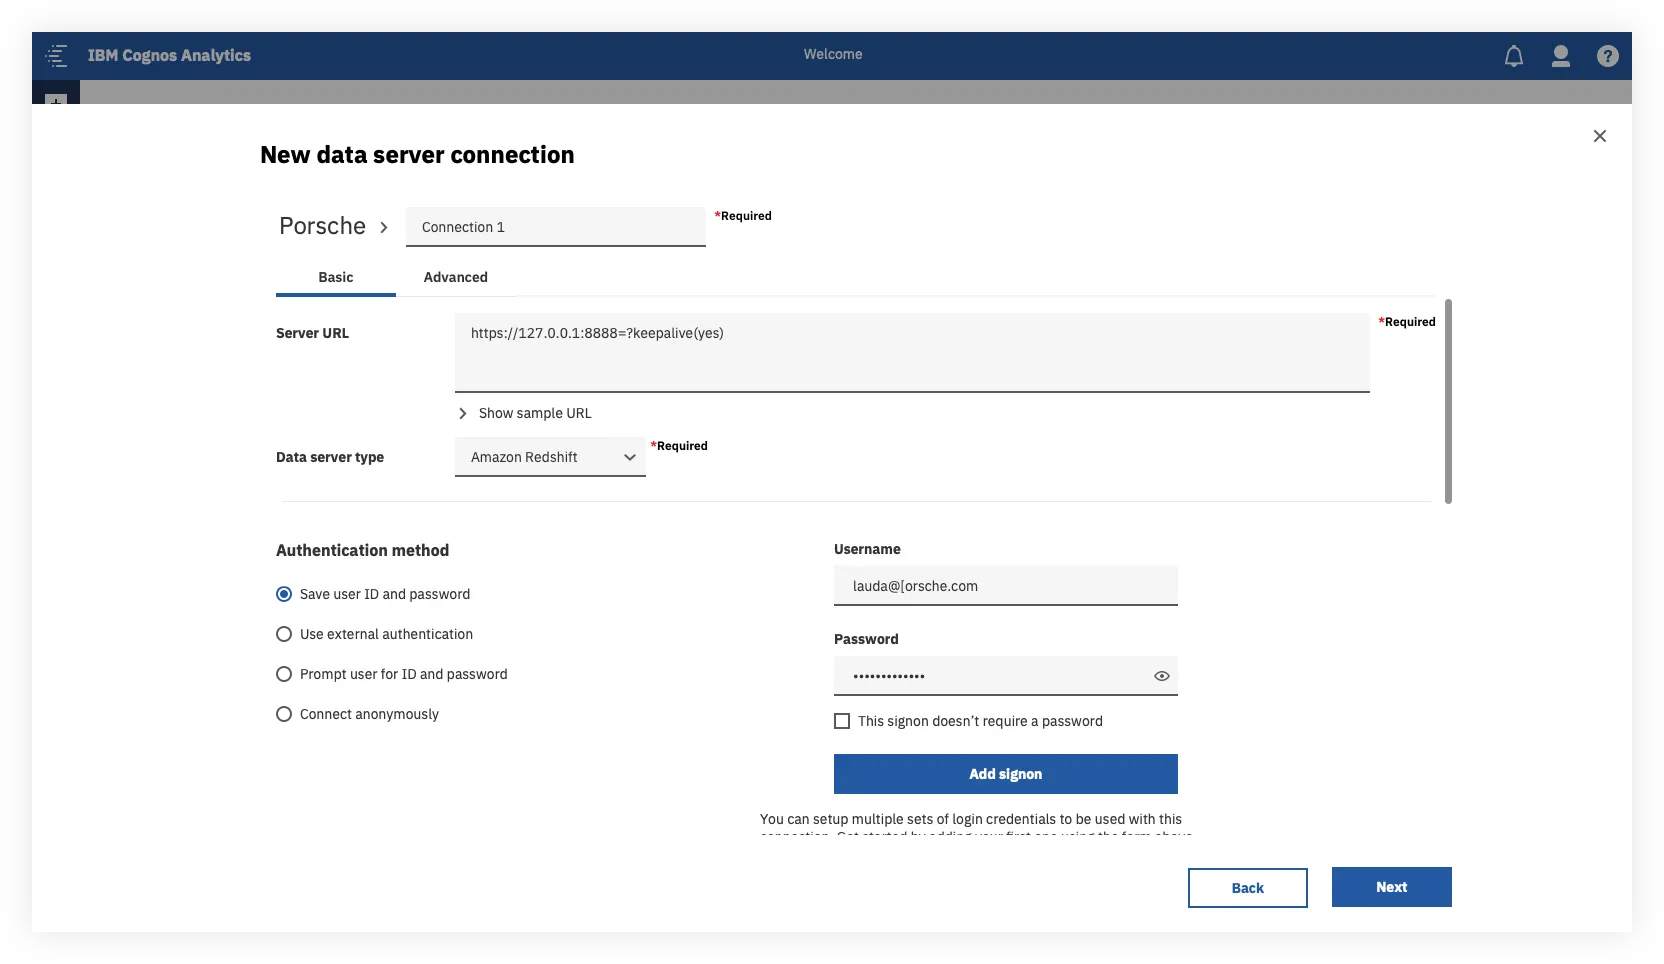
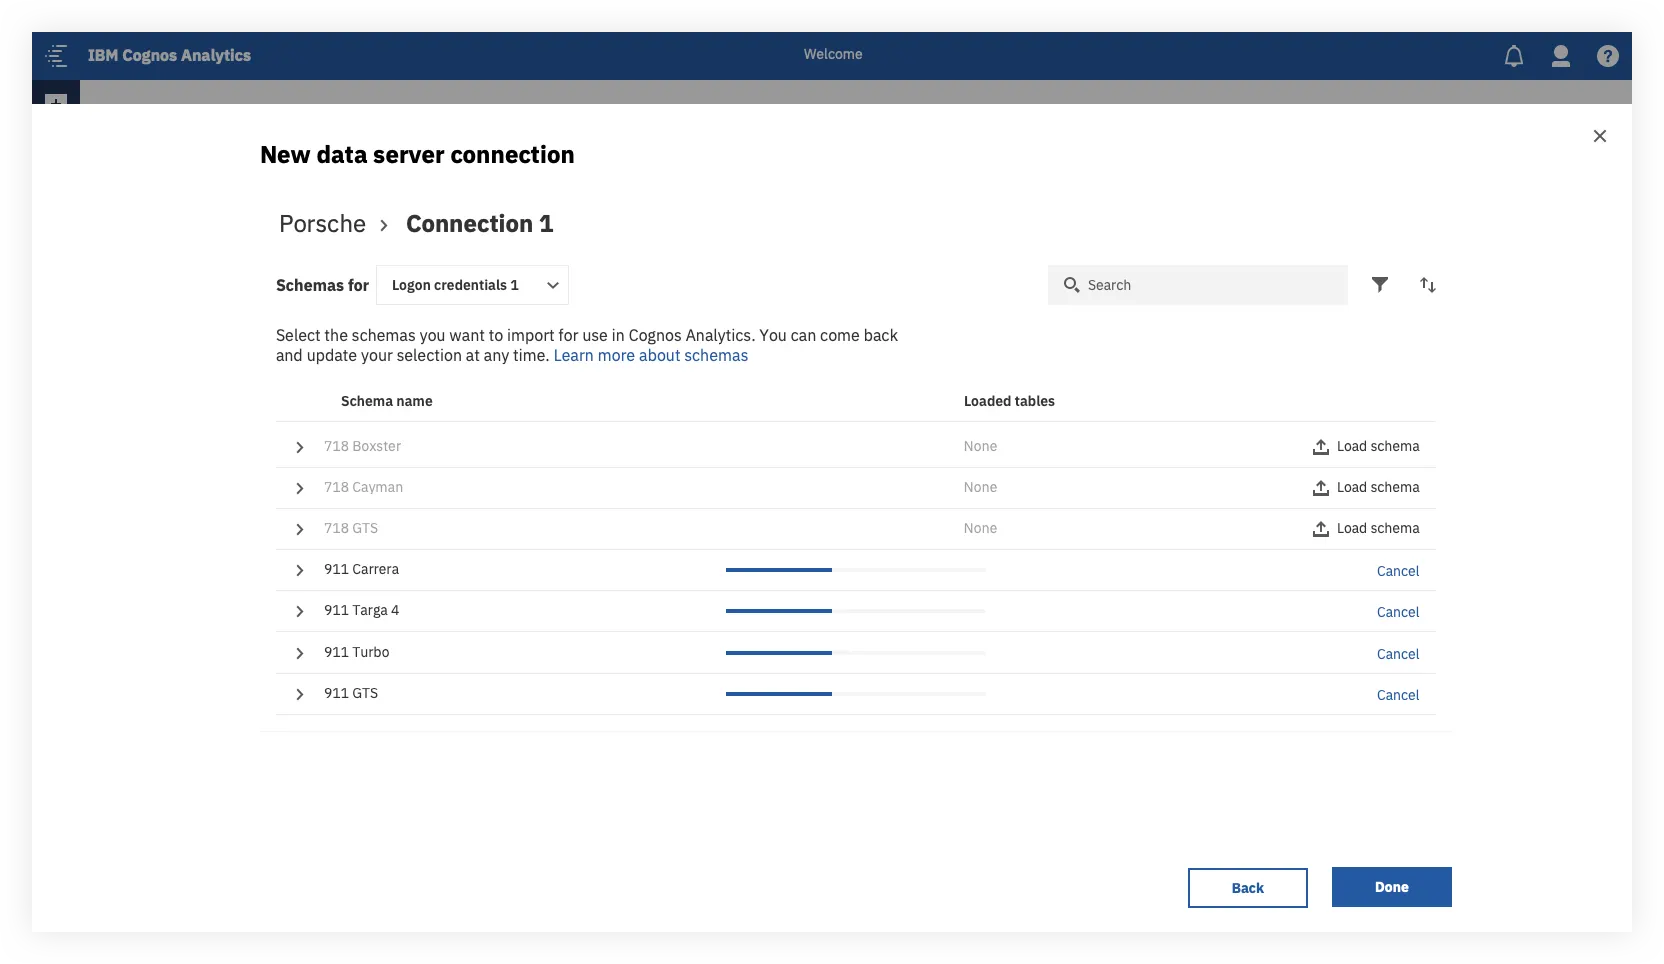
For an analysts, the intention was to be able to create a new connection in 3 steps:
- Give us a name and a URL — based on that URL we’ll configure all the required settings for you.
- Set up your authentication method — we’ll preselect the most commonly used option for this data server type.
- Choose what data you want to load — and you’re done!
This is a much more streamlined approach than the previous experience for both analysts and admins alike.
For power users, the ability to perform more heavy duty configuration is still there, but the non-essential and more technical fields have been placed under the advanced tab.
The Server List
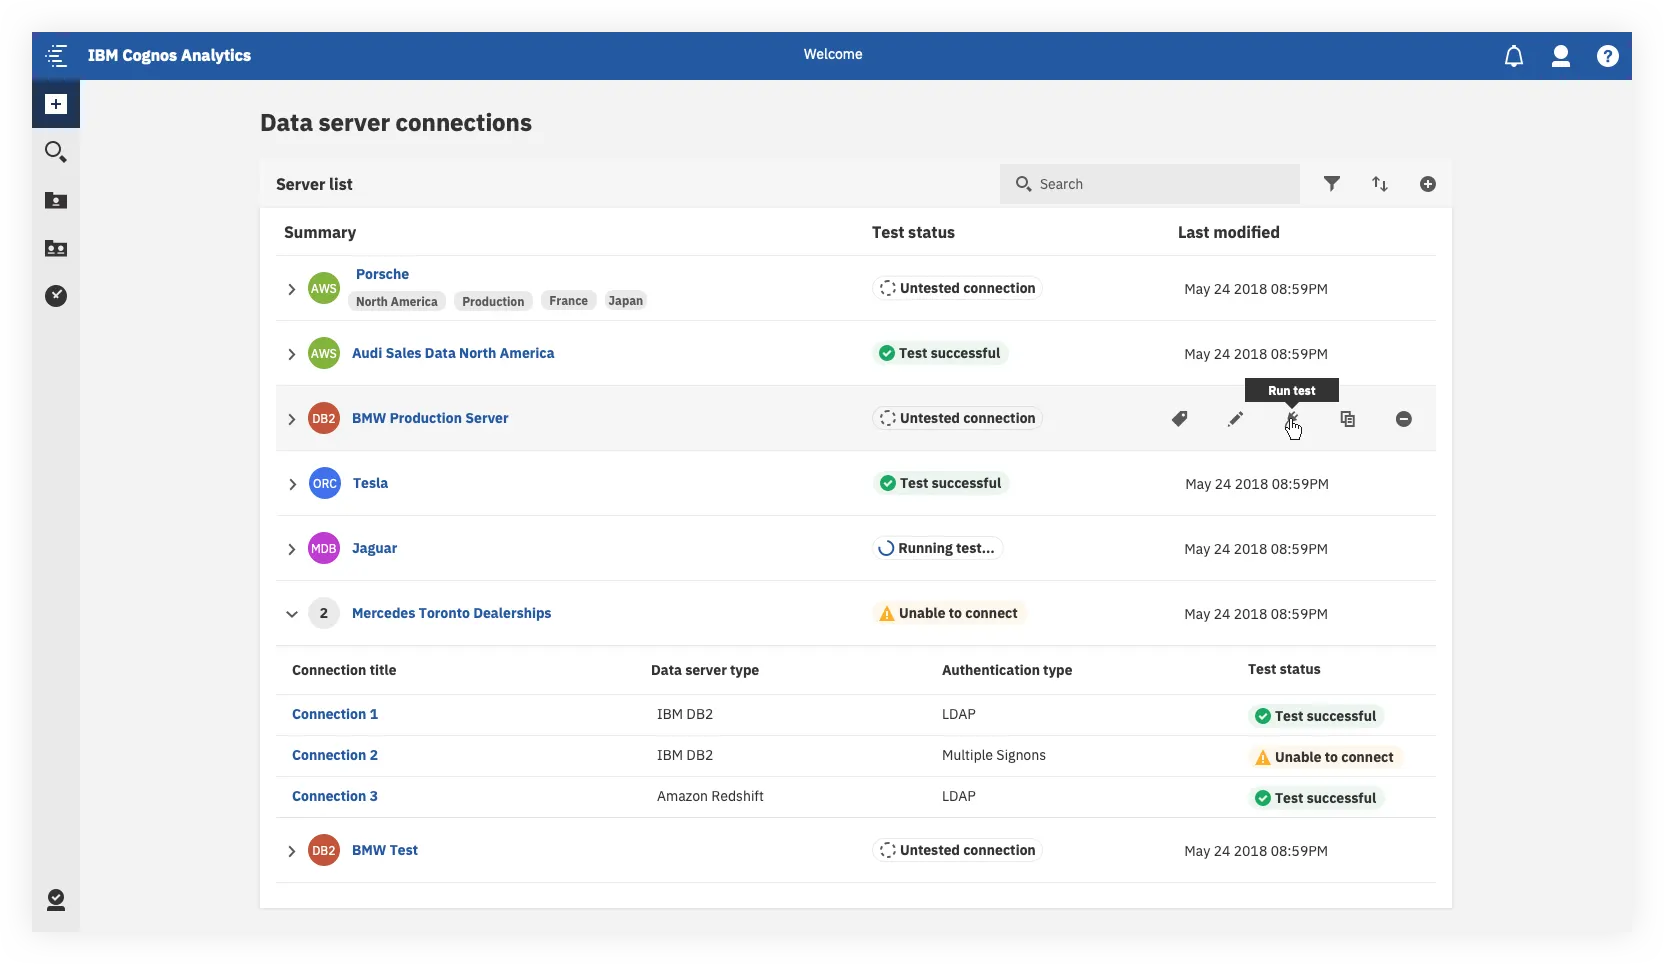
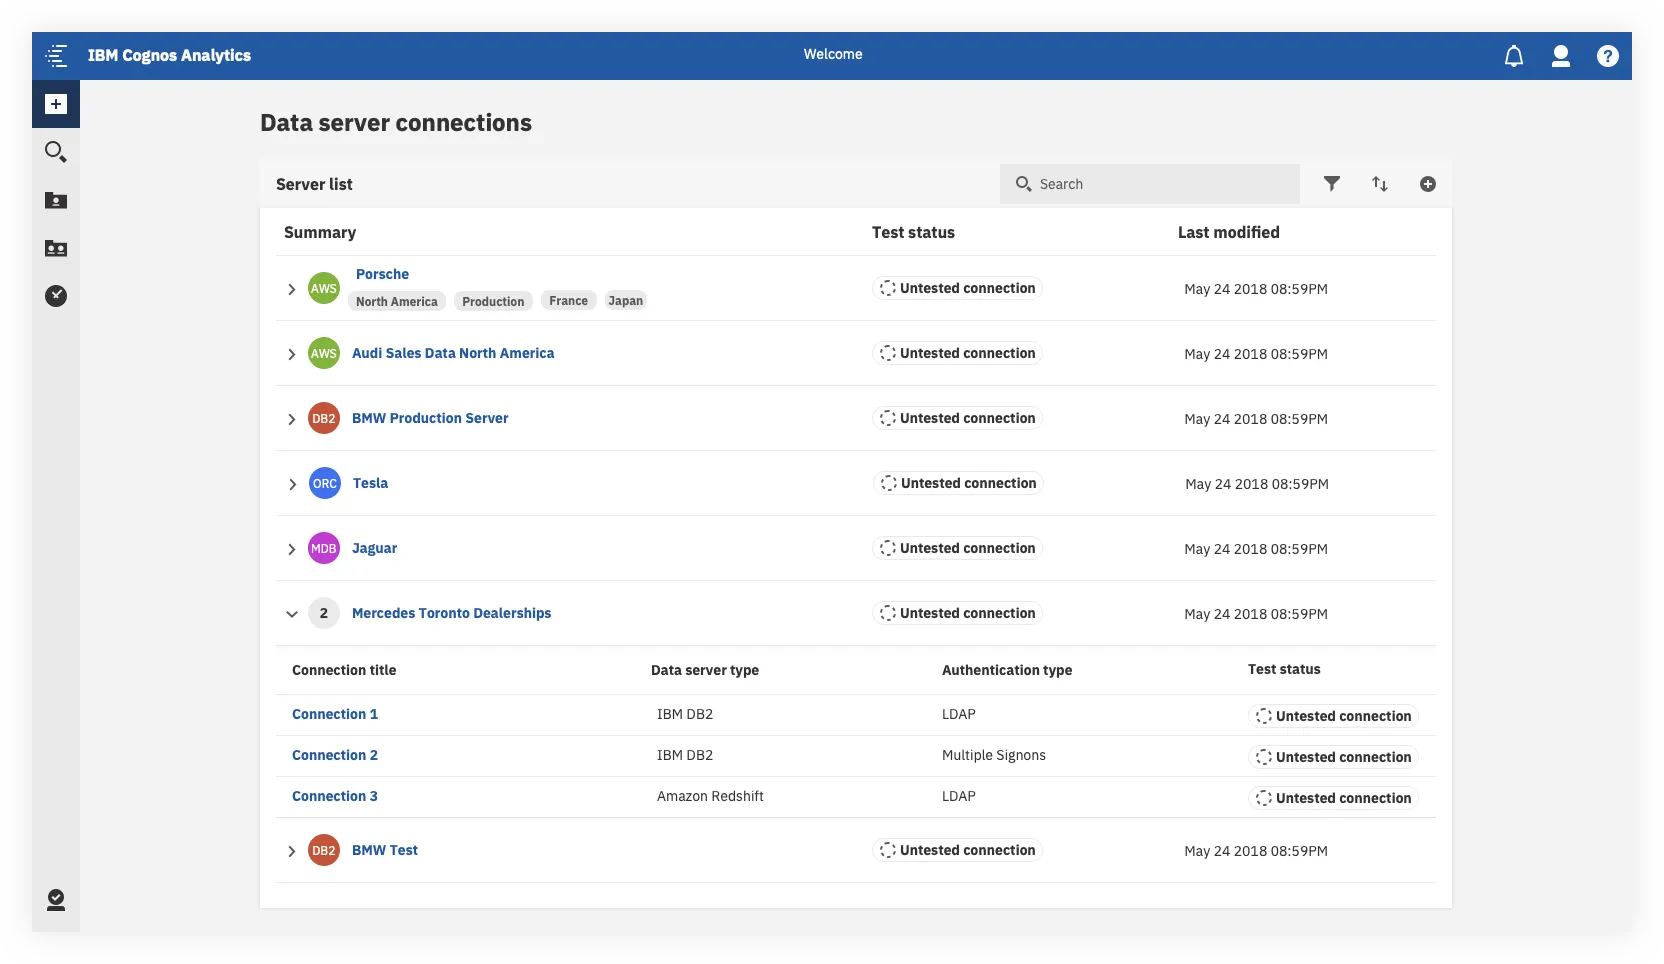
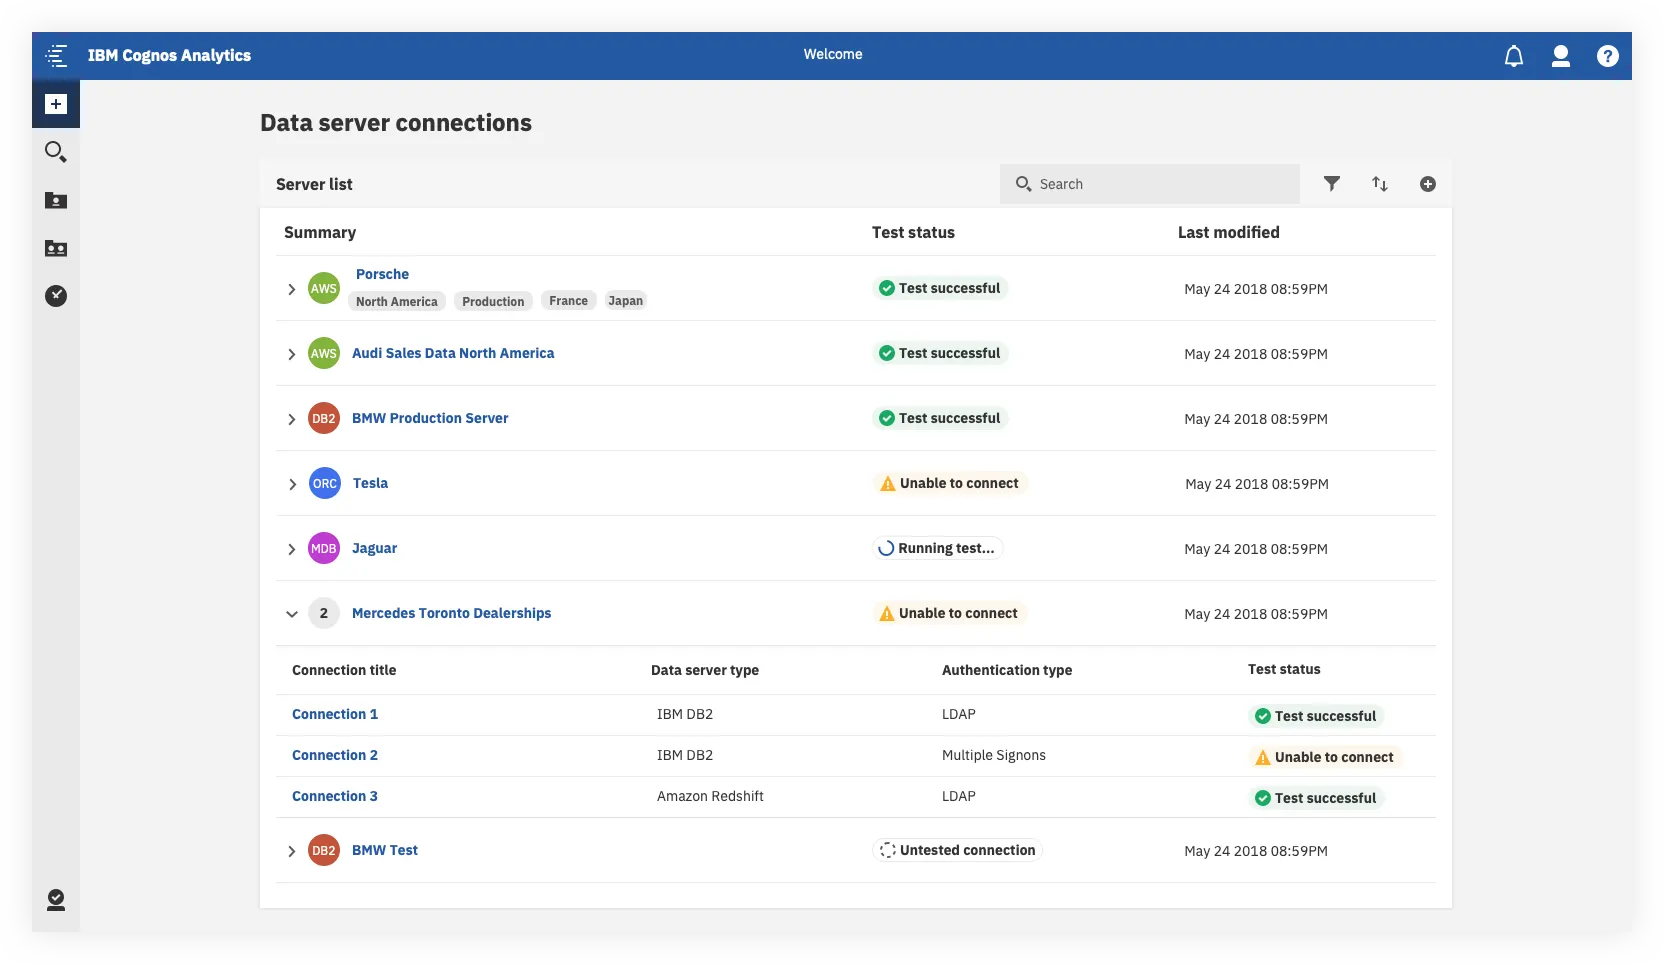
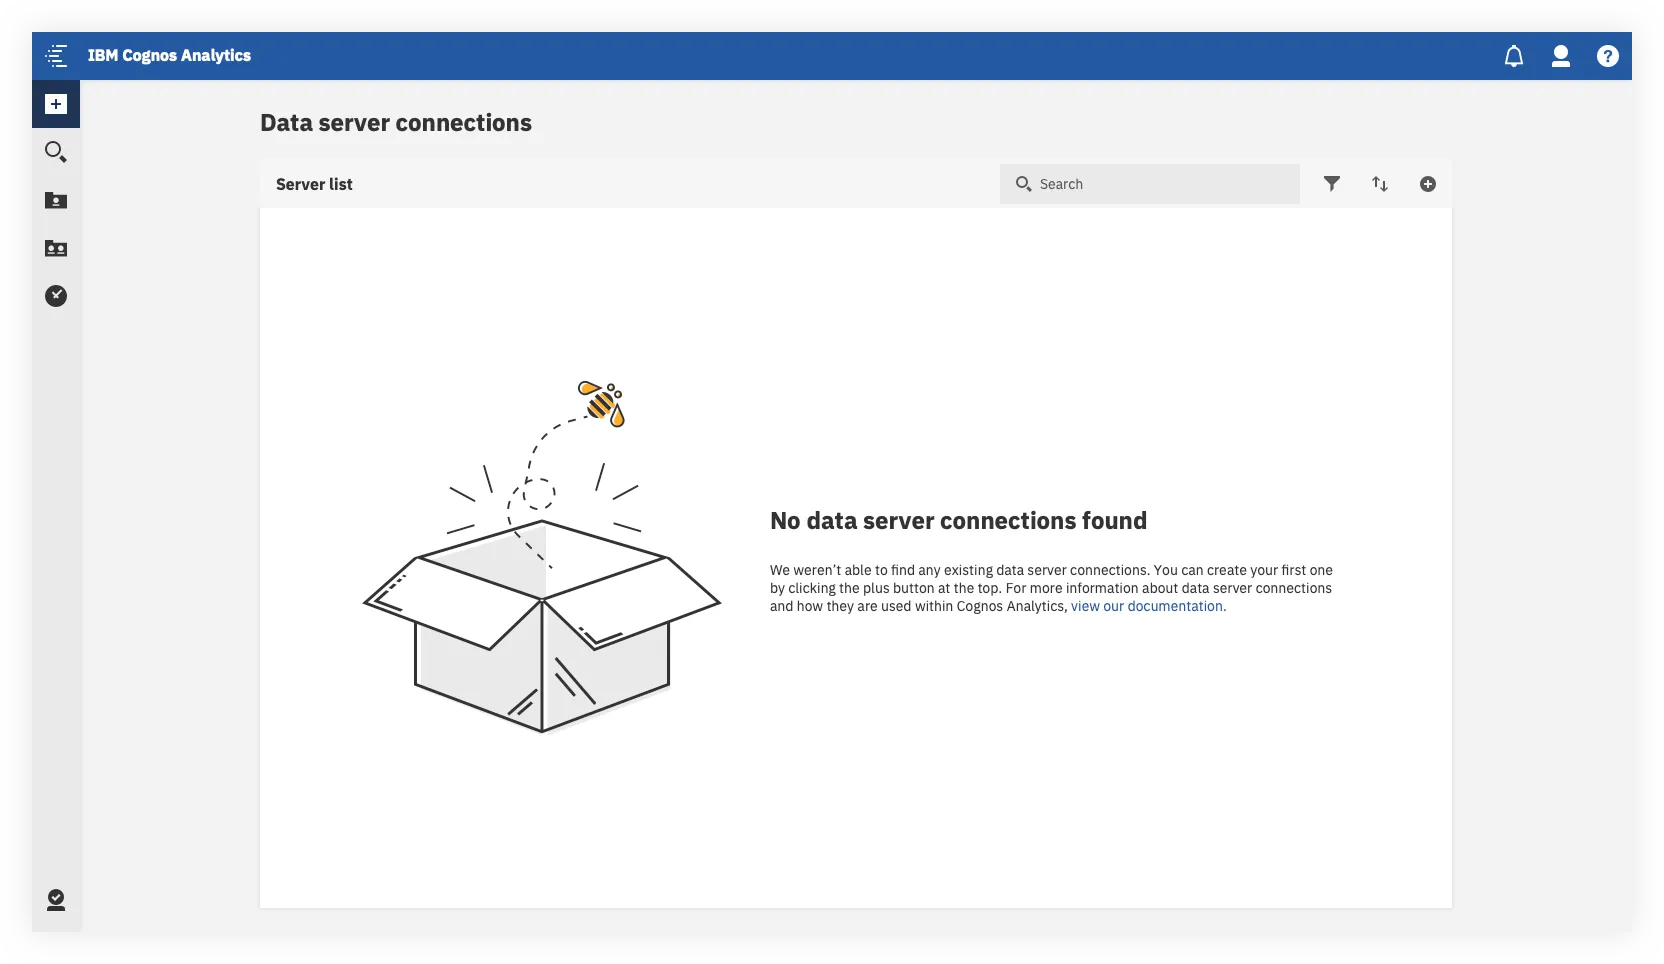
The key user outcomes here were the following:
- We’ve given sys admins more high level, glanceable information about their existing servers and connections, and the ability to better organize these items.
- We’ve added the ability to test multiple connections quickly, without needing to drill down through multiple levels of the UI. Something that required at least five clicks to do before could now be done in one.
A couple of things here got held back for our MVP
- The visualizations and summary view at the top
- Live tracking and display of each connection’s status
This was primarily due to technical limitations, but we still wanted to give users a clear visual indicator that showed which connections have been tested and which connections needed troubleshooting.
The Server Details, Connection Details and Authentication Details Views
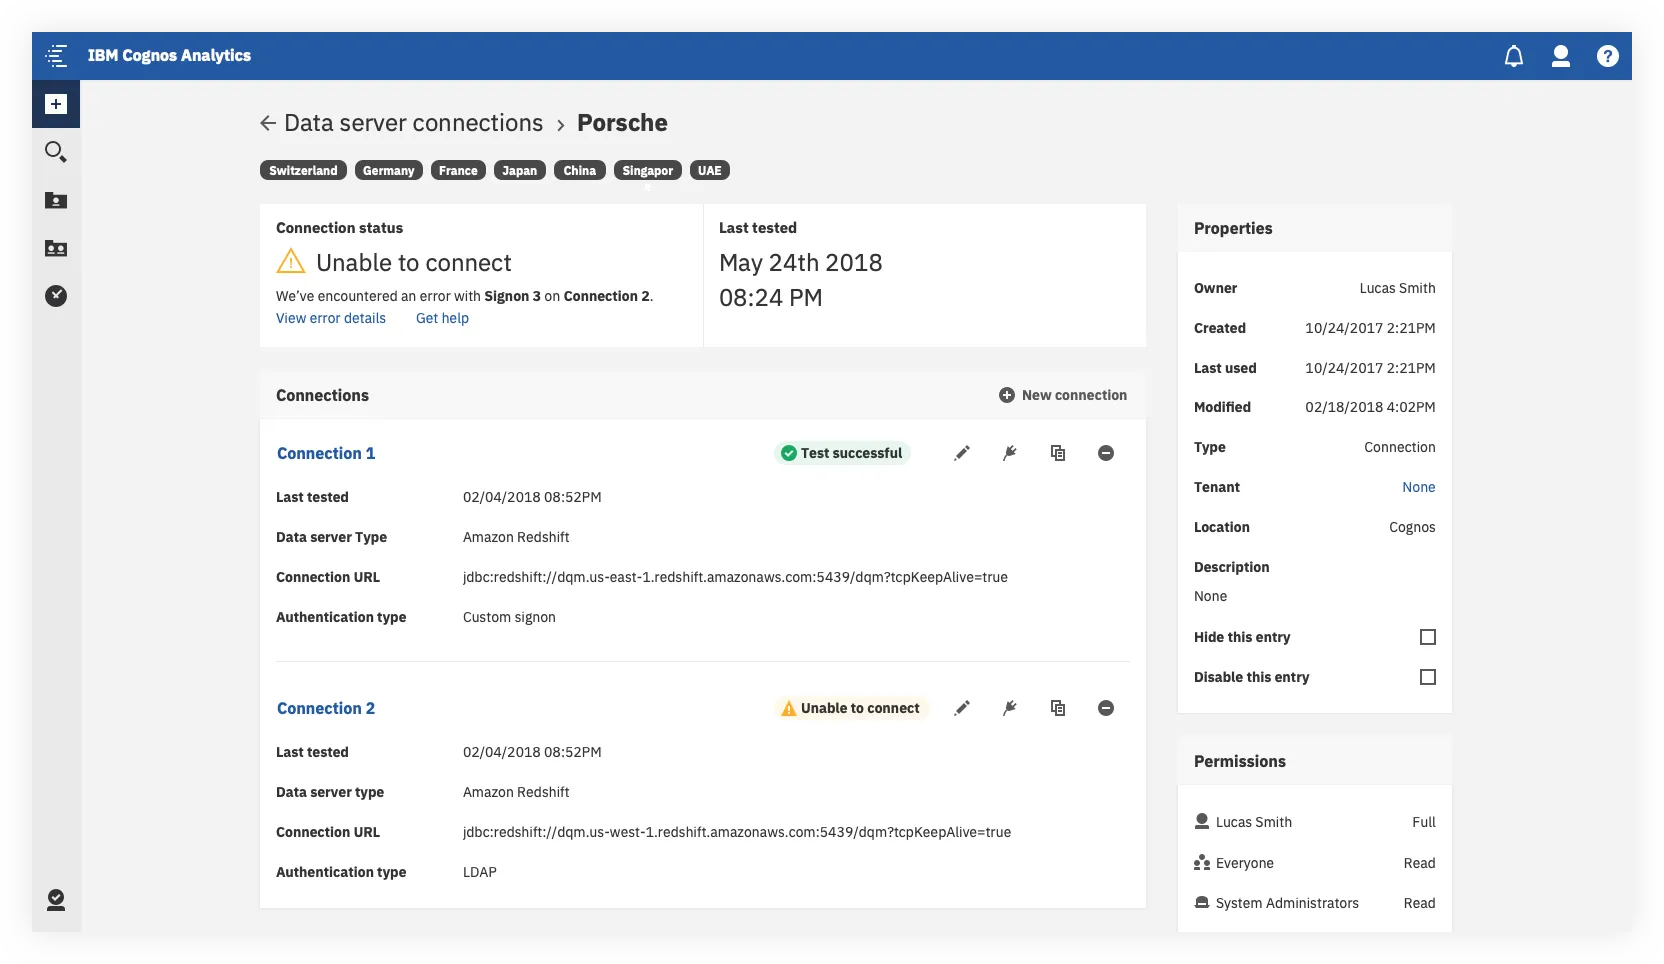
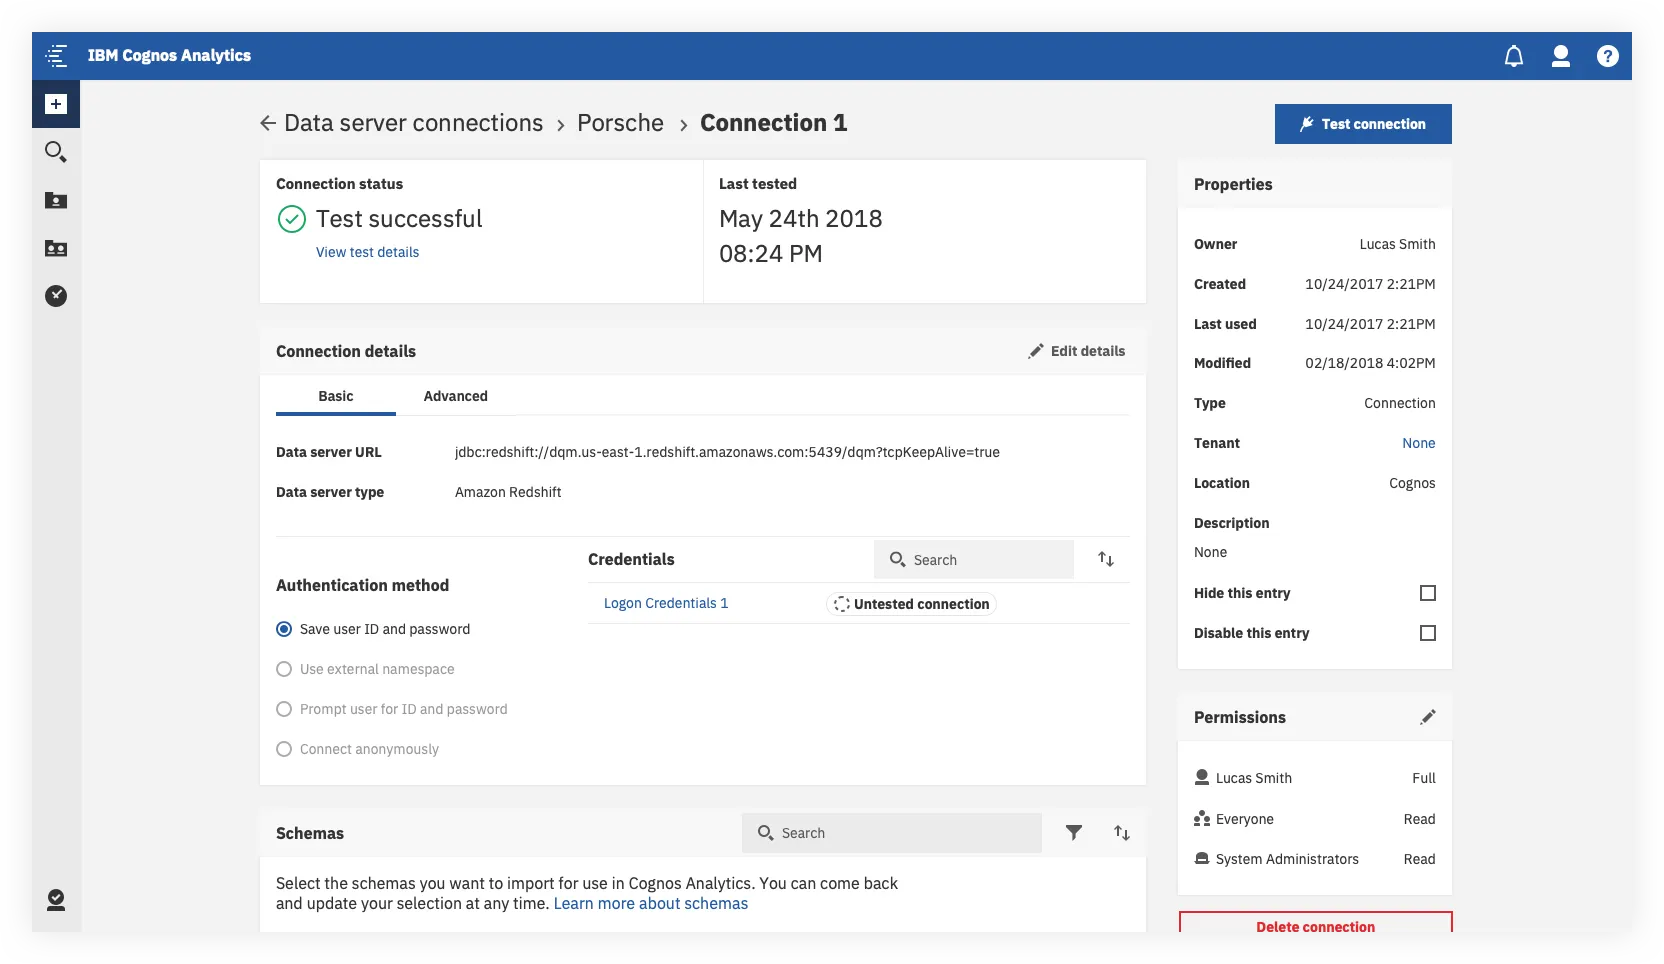
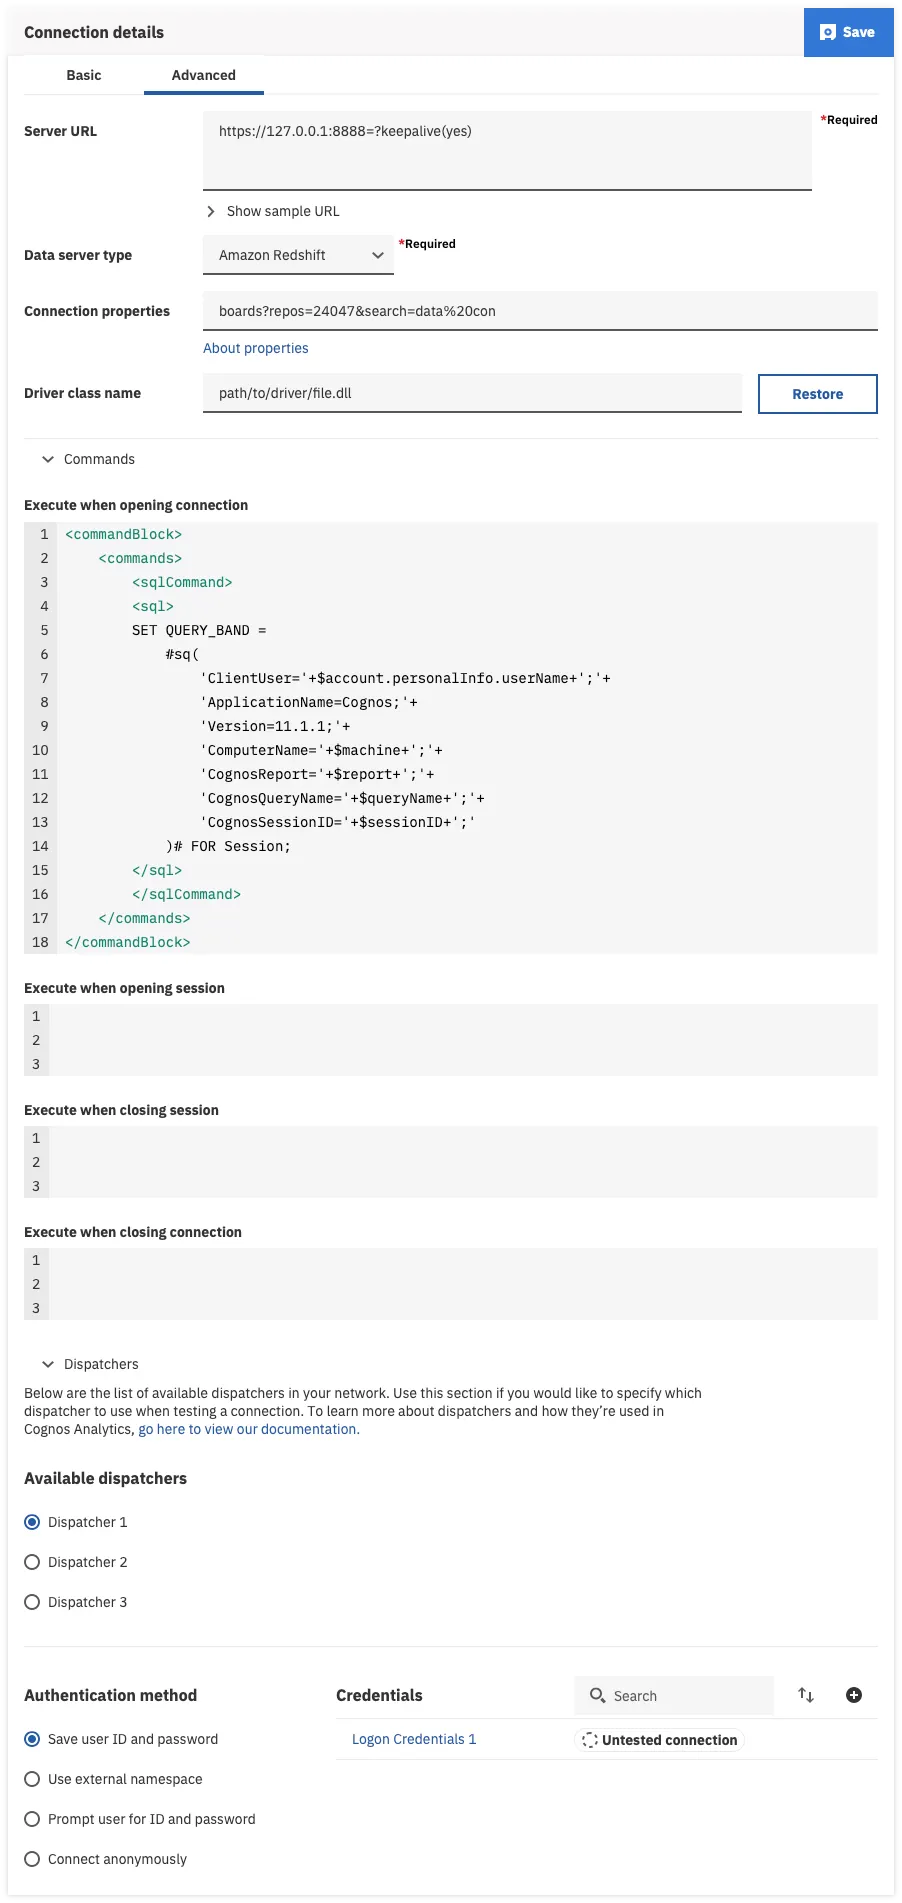
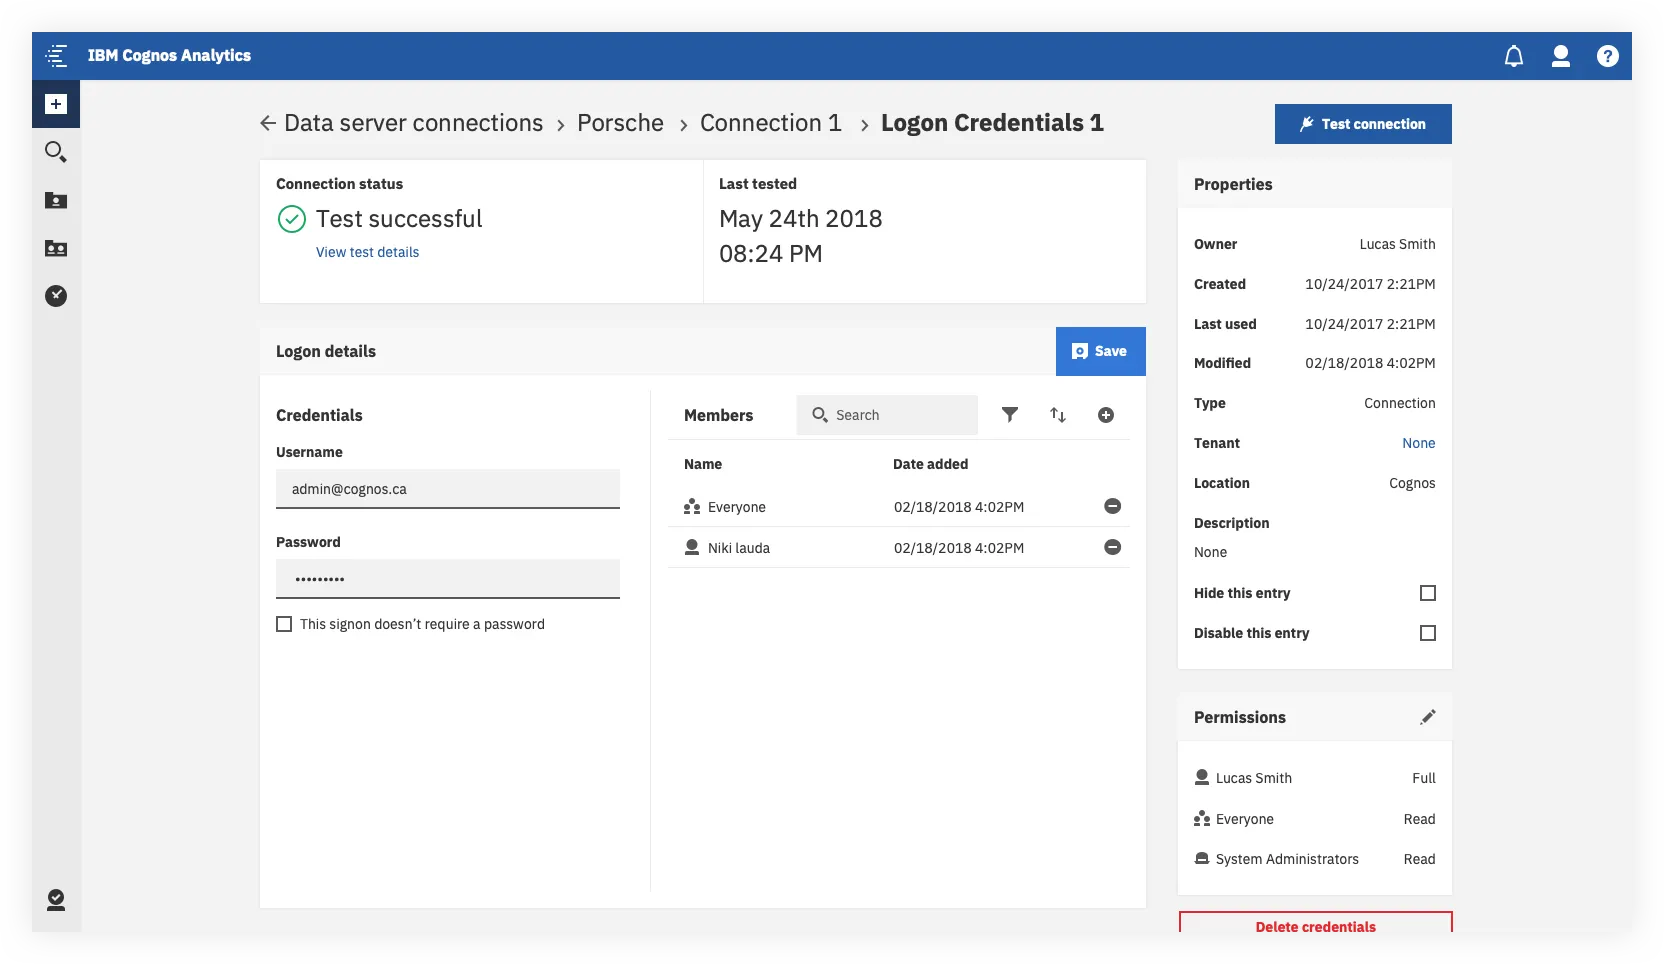
As users continued to drill down through the various levels, the information displayed could get pretty complex. (See the third screengrab for an example of what a fully configured connection setup could look like in advanced view).
The desired user outcomes here were the following:
- The most relevant information is always front and center. If something breaks, users have a clear trail to follow, with links to support material at each step.
- Secondary info (such as permissions and object properties) are easily accessible but out of the way.
- Tests can be run quickly. But power users can run more complex tests and configurations if required.
Reflection
Overall Outcomes
This redesign ended up being much more complex than any of us had initially anticipated. This post here provides a glimpse into how we worked and the final outcome, but really I’ve only just scratched the surface.
It took us a few months to get there but the net outcomes of the redesign were the following:
- Analysts and Admins now both had ways of connecting to their data that integrated with their respective workflows.
- Key tasks were simplified and the information architecture was cleaned up. Seeing people navigate the Server > Connection > Authentication Method hierarchy clearly in the redesign when we were doing internal testing was a huge win for the team.
- The UI was completely redone and modernized, providing a more discoverable and cleaner experience..
- We introduced new capabilities around bulk actions, and made support documentation and in context help much more prominent.
- Built the design in a way which lays the groundwork for future enhancements around things like showing in context data visualization and introducing natural language based search and an AI driven UI.
Lessons learned
Looking back, the biggest takeaway for me was this — always be ready to learn, re-evaluate and adjust.
When dealing with sufficiently complex systems, (and especially legacy systems), chances are you’ll never have all the answers at the outset.
Requirements will change, unexpected technical limitations will surface, user validation will show you things you didn’t expect. Be ready to change course as a team accordingly — even in the 11th hour. Because designing a good solution and shipping one are two different things.
If this case study has piqued your interest and you’d like to hear more about how we incorporated testing and validation into our process, how we managed scope creep or worked through implementation, or if you have any other questions — feel free to get in touch!